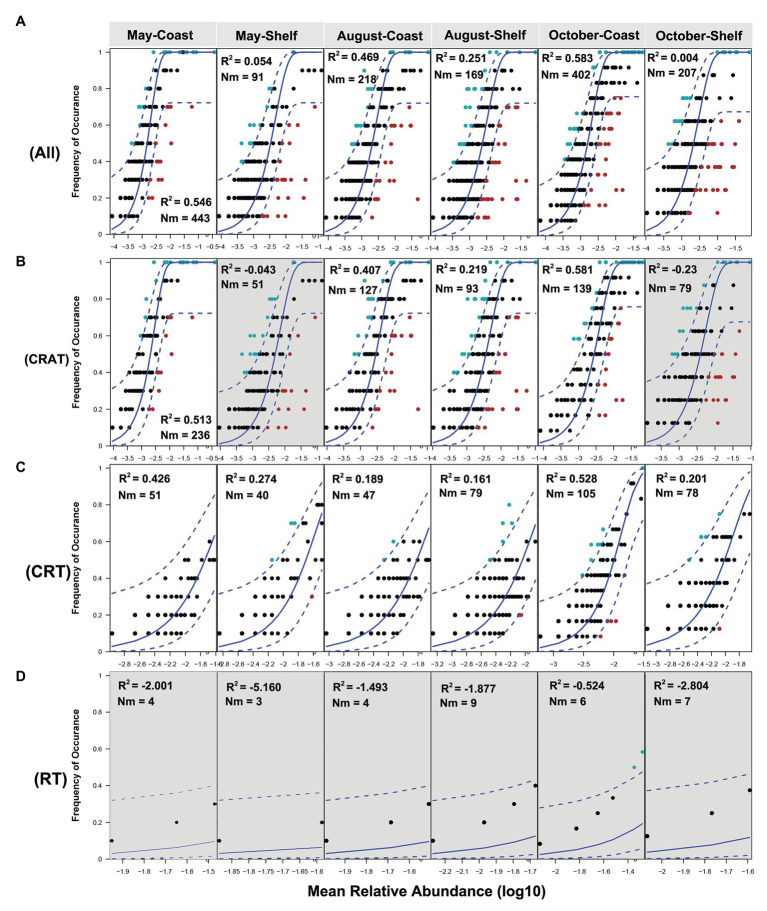
Figure 7.
Fit of the neutral model of community assembly. The predicted frequencies of OTUs from the set of the whole community (A. All), CRAT (B), CRT (C), and RT (D) sub-communities in coastal and shelf areas in 3 months are displayed, respectively. The solid blue lines indicate the best fit to the NM and dashed blue lines represent 95% CIs around the model prediction. OTUs that occur more or less frequently than predicted by the NM are shown in different colors. Nm indicates the size of the metacommunity (N) times immigration rate (m), R2 indicates the fit to the Nm. Note that the datasets with negative R2 value indicate no fit to the neutral model, of which the backgrounds are in gray.

