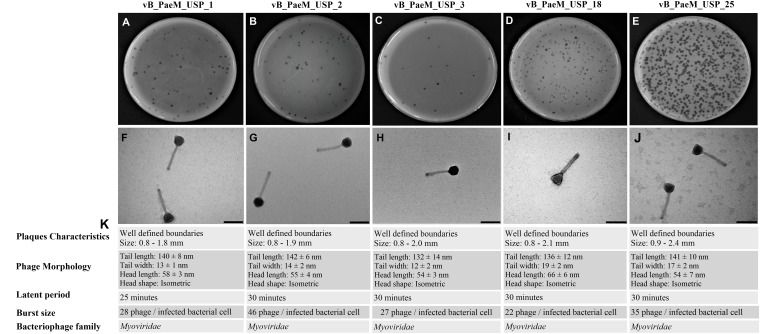
FIGURE 1.
(A–E) Representative image of phage isolates depicting different plaque morphologies of vB_PaeM_USP_1, vB_PaeM_USP_2, vB_PaeM_USP_3, vB_PaeM_USP_18, and vB_PaeM_USP_25. (F–J) Transmission electron micrographs of individual bacteriophages. (K) Panel of plaque characteristics, phage morphology, latent period, and burst size.

