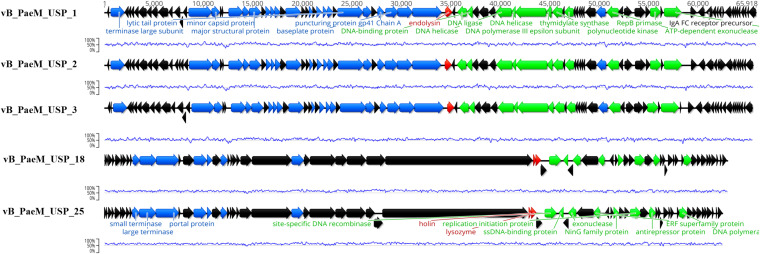
FIGURE 3.
Genome map of the five sequenced bacteriophages depicting the predicted open reading frames colored according to their predicted function (black for hypothetical proteins, green for genes involved in DNA replication and transcription, blue for DNA packaging and morphogenesis genes, and red for cell lysis genes). The blue line represents the guanine-cytosine content (%).

