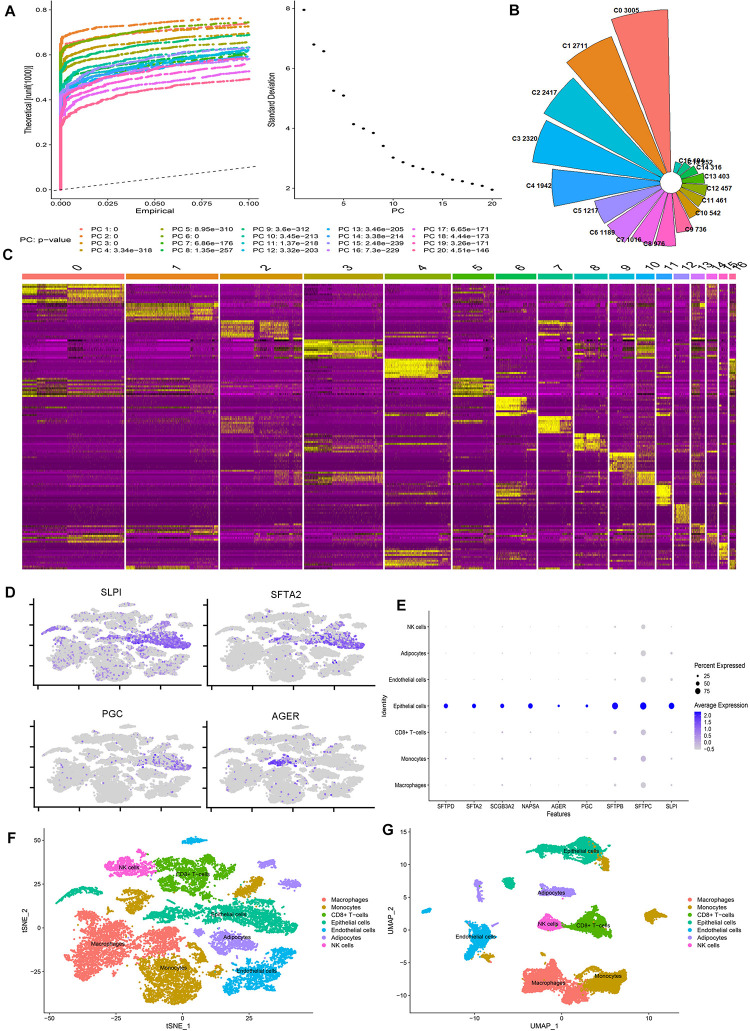
FIGURE 1.
scRNA-seq reveals the cell populations of the human lung. (A) Jackstraw plot and Elbow plot show the p-value distribution of each principal component (PC). (B) Nightingale’s rose diagram showed the proportion of each lung cell type. (C) Heatmap showing the differentially expressed gene of each cluster. (D) Scatter plot of classic marker genes in epithelial cells. (E) Bubble plots of the first nine marker genes identified in our study. (F,G) tSNE and UMAP plots showing all the identified cell types distribution.

