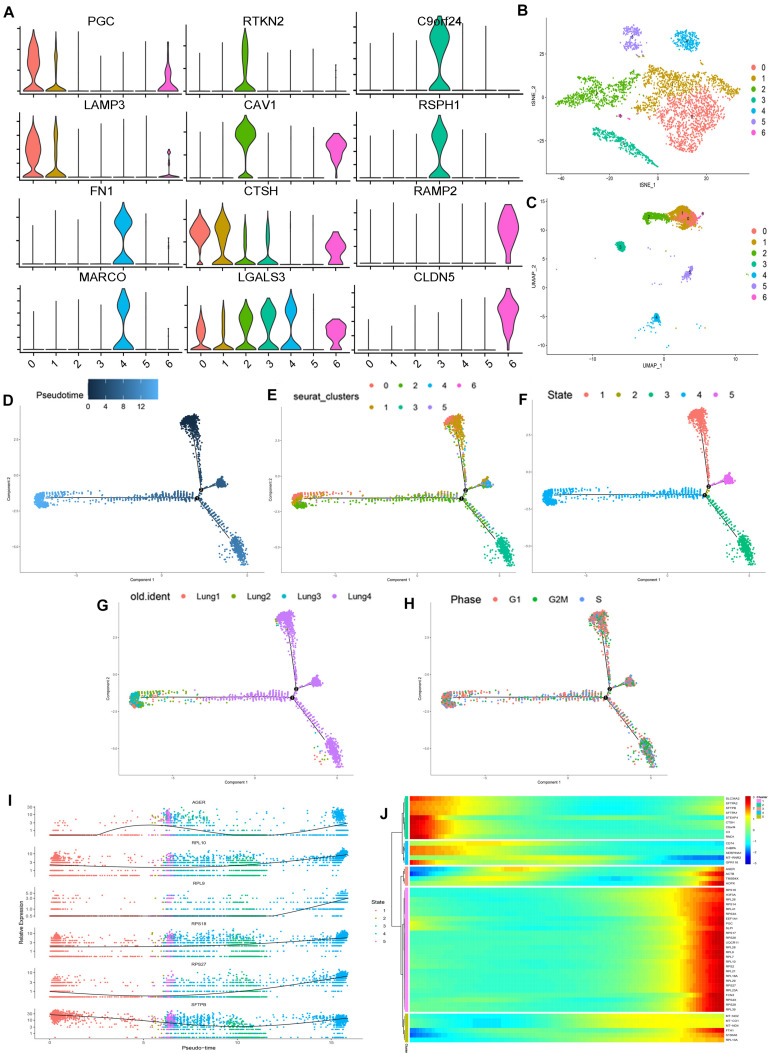
FIGURE 2.
Subpopulations of epithelial cells and reconstructing the developmental trajectory of epithelial cells. (A) Violin plots showing the expression of marker genes in each cluster of epithelial cells. (B,C) tSNE and UMAP plots showing all the epithelial cell subtypes distribution. (D) Pseudotemporal trajectory of seven subtype cells. (E) The gradual change from black to light blue indicates the change of pseudotime. (F) The pseudotime trajectory showed epithelial cells with five different states. (G) The trajectory showing the subtype cells come from four lung samples. (H) The trajectory showing the phase distribution of all cells in different branches. (I) According to the changes of gene expression in pseudotime, the top six genes that may affect the fate of cells were shown. (J) Heatmap showed the top 50 genes that affect cell fate decisions. The 50 genes were divided into five clusters.

