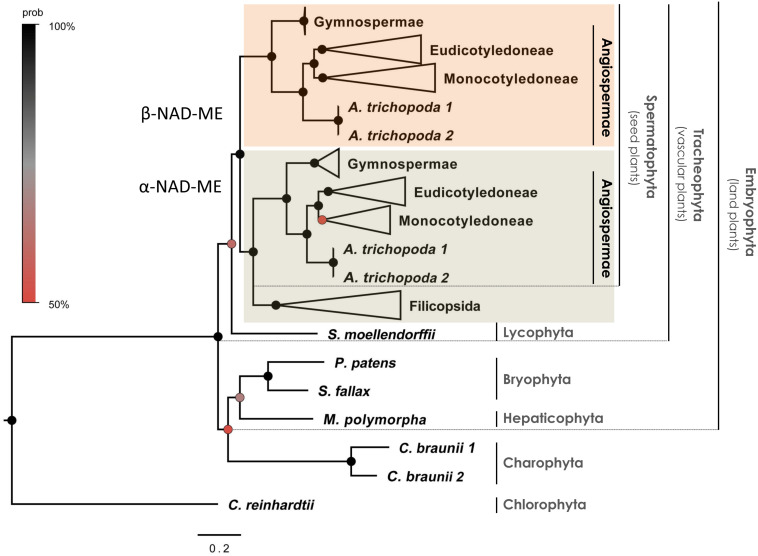
FIGURE 1.
Phylogenetic gene tree of α- and β-NAD-ME in the green lineage. The phylogenetic relationships were inferred from coding sequences using BI. The main clades are compressed and designated by their subdivision, class, order or family names. Black circles highlight nodes with Bayesian Posterior Probability (BPP) values higher than 90%, gray circles indicate BPP values higher than 70% and red circles indicate BPP values higher than 50%. The three positions of codons were optimized separately (partitioned tree). Best-fit substitution model was a GRT + G submodel (BPP = 0.90 ± 0.01) with individual rates values: m1 = 0.42, m2 = 0.33, and m3 = 2.74 for the 1st, 2nd, and 3rd position of codons, respectively. The full tree is available in Supplementary Data 1.

