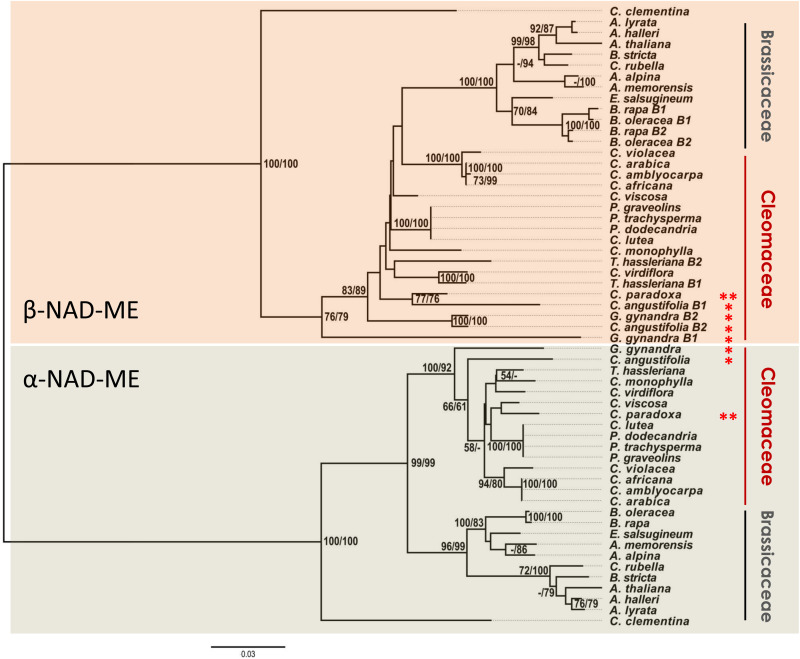
FIGURE 3.
Phylogenetic gene tree of NAD-ME proteins of Cleomaceae and Brassicaceae. The evolutionary history was inferred using the ML and NJ methods. The NJ optimal tree with the sum of branch length = 1.58 is shown. The tree is drawn to scale, with branch lengths measured in the number of substitutions per site. The evolutionary distances were computed using the JTT matrix-based method with a discrete Gamma distribution to model evolutionary rate differences among sites (G, parameter = 0.52). Support values of 2,000 bootstrap replicates are given as MLB/NJB next to the branches when greater than 50%. The analysis involved 57 amino acid sequences and there were 227 parsimony-informative sites over a total of 597 positions (less than 40%) in the final dataset. Red * and ** indicate C4 and C3–C4 photosynthetic metabolism, respectively. Citrus clementina NAD-ME isoforms were used as out groups. The full trees are available in Supplementary Data 4 and Supplementary Data 5.

