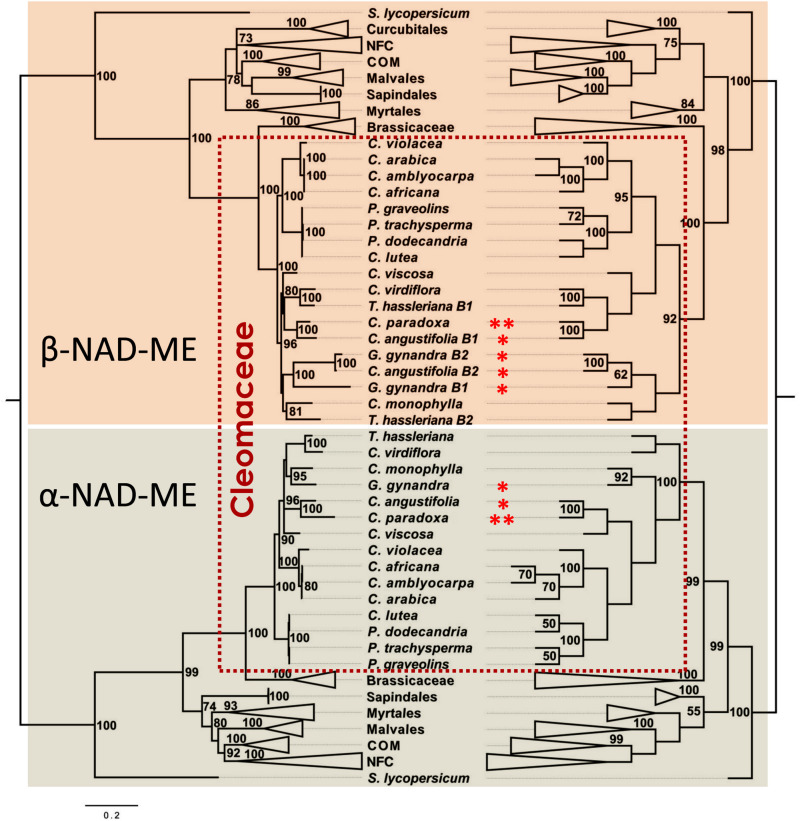
FIGURE 4.
Evolutionary history of NAD-ME genes in Cleomaceae deduced from third position of the codons. Bayesian (left) and Maximum Likelihood (right) phylogenetic tree of NAD-ME of the Rosid lineage. Most of the clades are compressed and designated by their Order or Family names. BPP and MLB values higher than 70 and 50%, respectively, are given next to the branches. In the BI analysis, the tree is drawn to scale with branch lengths measured in the number of substitutions per site. In the ML analysis, the bootstrap consensus tree (dendogram) inferred from 2,000 replicates is taken to represent the evolutionary history of the taxa, in which the partitions reproduced in less than 50% of the bootstrap replicates are collapsed. In both analyses, the best-fit substitution model was a GRT + G (3.70) model involving 124 nucleotide sequences and a total of 497 positions in the final dataset. * and ** indicate C4 and C3–C4 photosynthetic metabolism, respectively. Solanum lycopersicum NAD-MEs coding sequences were used as out groups. The full trees are available in Supplementary Data 6 and Supplementary Data 7.

