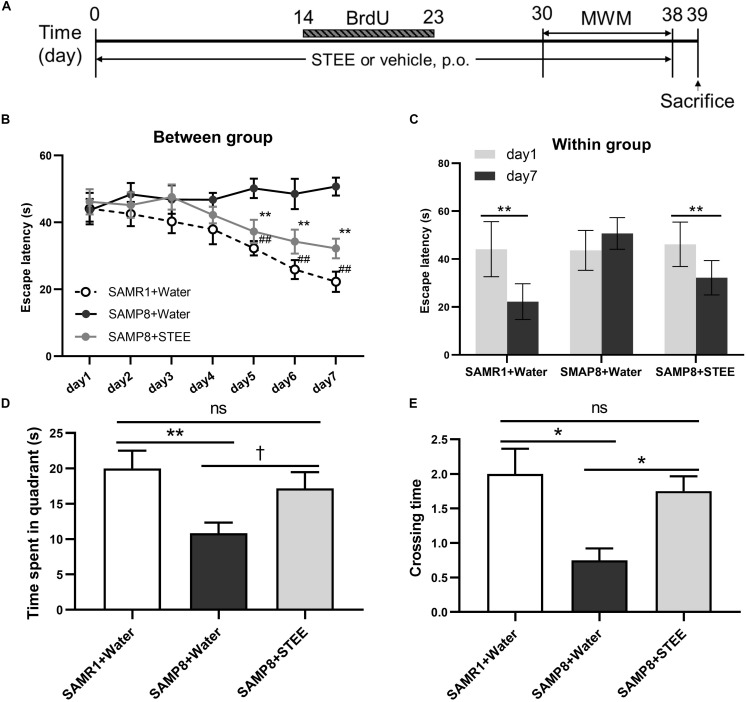
FIGURE 2.
Effects of STEE on spatial learning and memory determined with the Morris Water Maze. (A) Experimental timeline. (B) Escape latency of each treatment group at different time points. Asterisk refers to significant difference between water and STEE-fed SAMP8 mice (SAMP8 + Water vs. SAMP8 + STEE; **p < 0.01). Hash sign refers to significant difference between SAMP8 and SAMR1 control mice given water (SAMP8 + Water vs. SAMR1 + Water; ##p < 0.01). The differences among treatment groups were assessed using two-way repeated-measures ANOVA followed by Fisher’s LSD test. (C) Escape latency of each treatment group before and after 7-day training sessions in MWM tests: **p < 0.01. (D) Effects of STEE on time spent in target quadrant in the probe test. Differences between the groups were analyzed using one-way ANOVA with Fisher’s LSD test: **p < 0.01, †p = 0.054; ns, non-significant. (E) Effects of STEE on numbers of crossing over the platform in the probe test. Pair-wise comparisons among the groups were performed using Kruskal-Wallis test followed by Dunn’s post hoc test: *p < 0.05; ns, non-significant. Values are presented as mean ± SEM (n = 6 animals per group).

