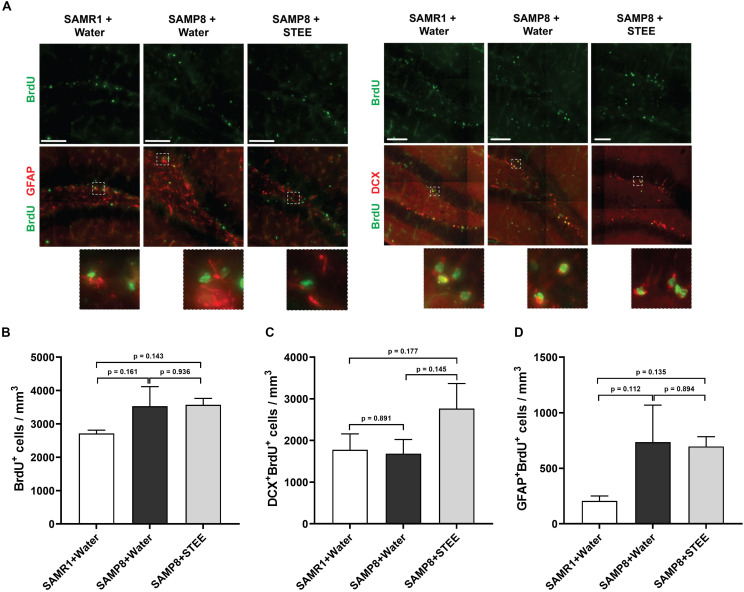
FIGURE 3.
Levels of proliferation and differentiation markers in the hippocampal SGZ. (A) Representative images of immunolabeling for BrdU, DCX, and GFAP in SAMR1 mice given water, SAMP8 mice given water and SAMP8 mice given STEE. Scale bar: 100 μm. (B) Total number of BrdU positive proliferating cells in the SGZ of animals. (C) Number of DCX/BrdU double-positive newborn immature neurons. (D) Number of GFAP/BrdU double-positive cycling astrocytic stem cells and progenitors. The error bar represents the ± SEM (n = 3 animals per group). Comparisons were performed through one-way ANOVA with Fisher’s LSD test.

