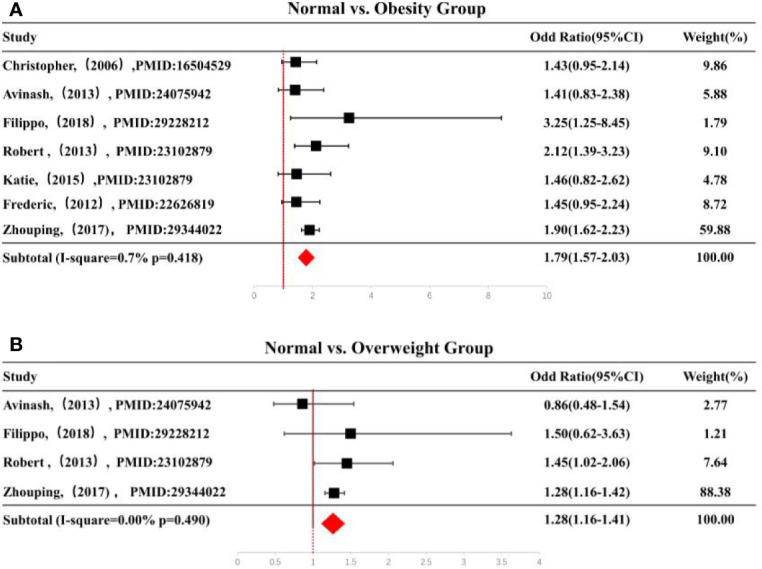
Figure 2.

(A) Forest plot of ORs of obesity vs. normal weight and (B) forest plot of ORs of overweight vs. normal weight. Black squares indicate the OR in each study, horizontal lines represent the 95% CI. OR, odd ratio; CI, confidence interval; BMI, body mass index.
