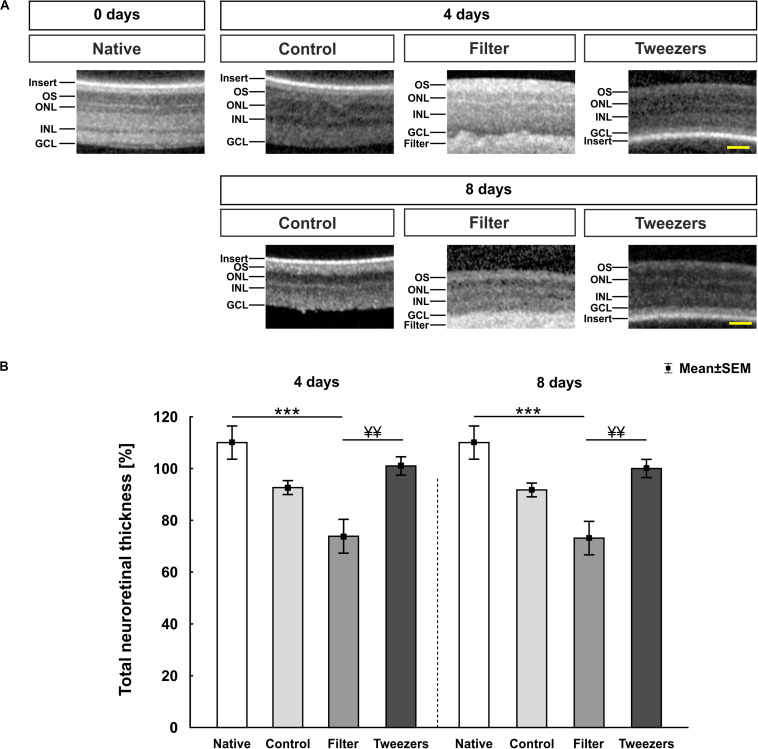
FIGURE 2.
Spectral Domain Optical Coherence Tomography (SD-OCT) analysis of porcine retinas. (A) Exemplary pictures of all measured time points and used techniques. Samples of all three explantation methods and the native group were investigated at 0 (= native), 4, and 8 days via SD-OCT. (B) At 4 days, no changes were noted in regard to the retinal thickness between control and native samples. A significantly thinner retinal thickness was revealed in filter (p < 0.001), but not in tweezers samples, compared to native retinas. No alterations were noted in filter and tweezers retinas compared to the controls. The filter group showed a significantly decreased retinal thickness compared to the tweezers group (p = 0.008). The retinal thickness of control and native samples was comparable at 8 days. While a significant thinning of the filter group was observed compared to native retinas (p < 0.001), no changes were noted between tweezers and native samples. Furthermore, the retinal thickness of the filter group was significantly diminished compared to tweezers samples (p = 0.008). OS, photoreceptor outer segments; ONL, outer nuclear layer; OPL, outer plexiform layer; INL, inner nuclear layer; IPL, inner plexiform layer; GCL, ganglion cell layer. Scale bars: 50 μm, values are mean ± SEM. n = 5/group. ***p < 0.001 vs. native group; ¥¥p < 0.01 vs. filter group.

