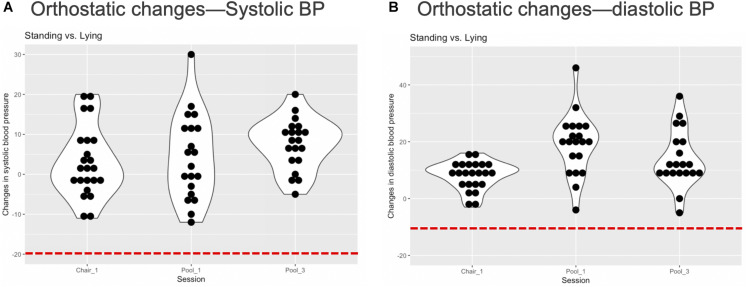
FIGURE 4.
Individual orthostatic blood pressure changes. (A) The figure displays each individual’s change in systolic blood pressure (BP) from lying to standing at the end of each REST session. There was no evidence of systolic orthostatic hypotension in any individual, i.e., a reduction in systolic BP below 20 mmHg (red dashed line). (B) The figure displays each individual’s change in diastolic BP from lying to standing at the end of each REST session. There was no evidence of diastolic orthostatic hypotension in any individual, i.e., a reduction in systolic BP below 10 mmHg (red dashed line). Note that BP was not measured during the second pool session and is therefore unlisted.

