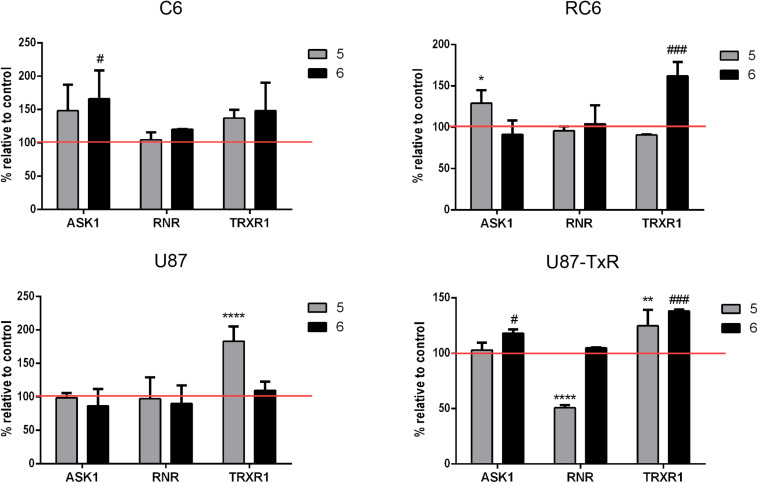
FIGURE 3.
Immunostaining of proteins ASK1, RNR, and TrxR1 in C6, RC6, U87, and U87-TxR cell lines. Changes in expression of proteins in cells treated with 2 μM 5 and 8 μM 6 are compared to untreated control (set at 100%, red line). All results represent mean values ± SD, obtained from three independent experiments (n = 3). p < 0.05 (*), p < 0.01 (**), and p < 0.0001 (****) indicate significantly different levels of expression in cells treated with compound 5 in comparison with untreated control. p < 0.05 (#) and p < 0.001 (###) indicate statistical significance between untreated control and cells treated with 6.

