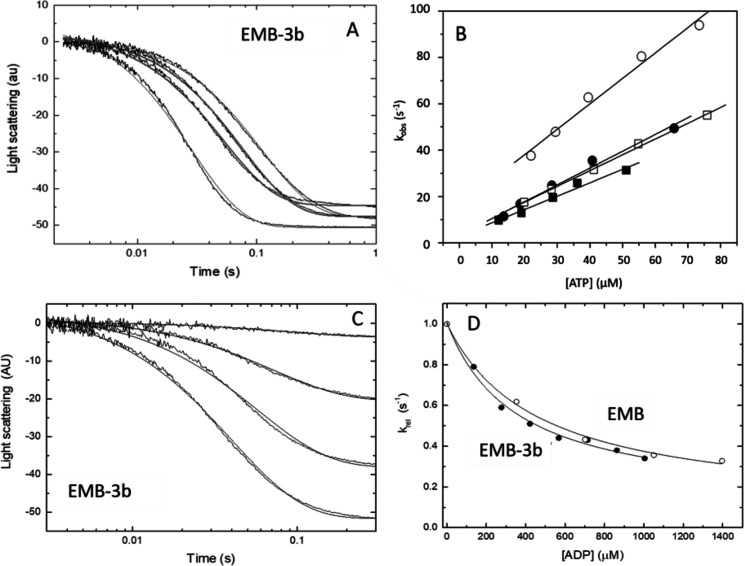
Figure 2.
ATP-induced dissociation (K1k+2) and ADP affinity (KAD) of the two myosin S1 exon 3 chimeras. A, example of light-scattering traces for acto-S1 dissociation with EMB-3b S1. B, the second-order rate constant (K1k+2) for the ATP-induced dissociation of S1 from actin is determined from a linear fit to the plot of the kobs versus [ATP] (see “Experimental Procedures”). The linear fits yielded values of 0.71 ± 0.12 μm−1 s−1 for EMB-3b (filled circles) as compared with 0.91 ± 0.13 μm−1 s−1 for EMB (open circles). For IFI-3a the linear fits yielded mean values of 0.66 ± 0.08 μm−1 s−1 (filled squares) as compared with 0.75 ± 0.08 μm−1 s−1 for IFI S1 (open squares). C, light-scattering traces for acto-S1 dissociation with EMB-3b S1 at various ADP concentrations. D, comparison of the affinity of ADP for acto-S1 (KAD) for EMB and EMB-3b, with the relative kobs (krel) values shown. Hyperbolic fits resulted in KAD values of 587 ± 48 μm for EMB (open circles) and 496 ± 79 μm for EMB-3b S1 (filled circles).

