Figure 2.
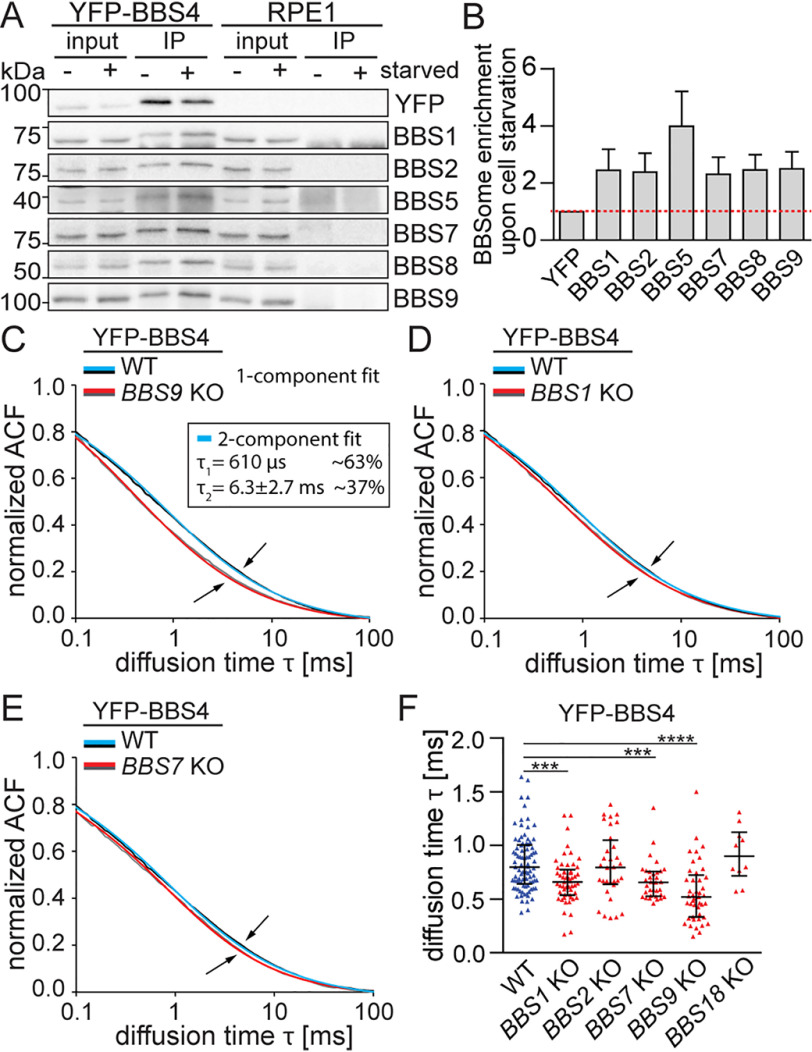
BBSome subcomplexes are present in the cytoplasm. A, co-immunoprecipitation (IP) of the BBSome subunits from YFP-BBS4 WT RPE1 cell lines using anti-GFP antibodies before and after 24-h serum starvation. A representative immunoblot out of three experiments is shown. B, quantification of the co-precipitated BBSome subunits was performed using the Fiji ImageJ software. The amount of the BBSome subunits was normalized to the YFP-BBS4 amount detected on the respective membrane. The mean with S.D. (error bars) of three experiments is shown. C–E, FCS measures the in vivo mobility of the BBSome subcomplexes in the cytoplasm. Plots show the autocorrelation functions (ACFs) obtained from FCS measurements in the cytoplasm of YFP-BBS4 in WT and in BBS9 KO (C), BBS1 KO (D), and BBS7 KO (E). The ACFs were fitted with a one-component anomalous 3D diffusion model (Table S3). The means of n > 20 measurements are shown. Note the elevated mobility of YFP-BBS4 in the BBS9 KO compared with BBS1 KO and BBS7 KO cells (arrows). YFP-BBS4 WT ACFs were additionally fitted by a two-component fit (inset). Diffusion time τ1 of the fast component was fixed to the mean diffusion time τ obtained from BBS9 KO cells, yielding the diffusion time τ2 of YFP-BBS4 engaged in a putative BBS4-BBS9 subcomplex. F, plot shows the diffusion times, τ, obtained by fitting the ACFs acquired from FCS measurements in YFP-BBS4 WT and BBS KO cell lines. Medians with interquartile range of n > 10 are shown. Statistical significance was calculated using a two-tailed Mann–Whitney test. ***, p < 0.001; ****, p < 0.0001.

