Figure 3.

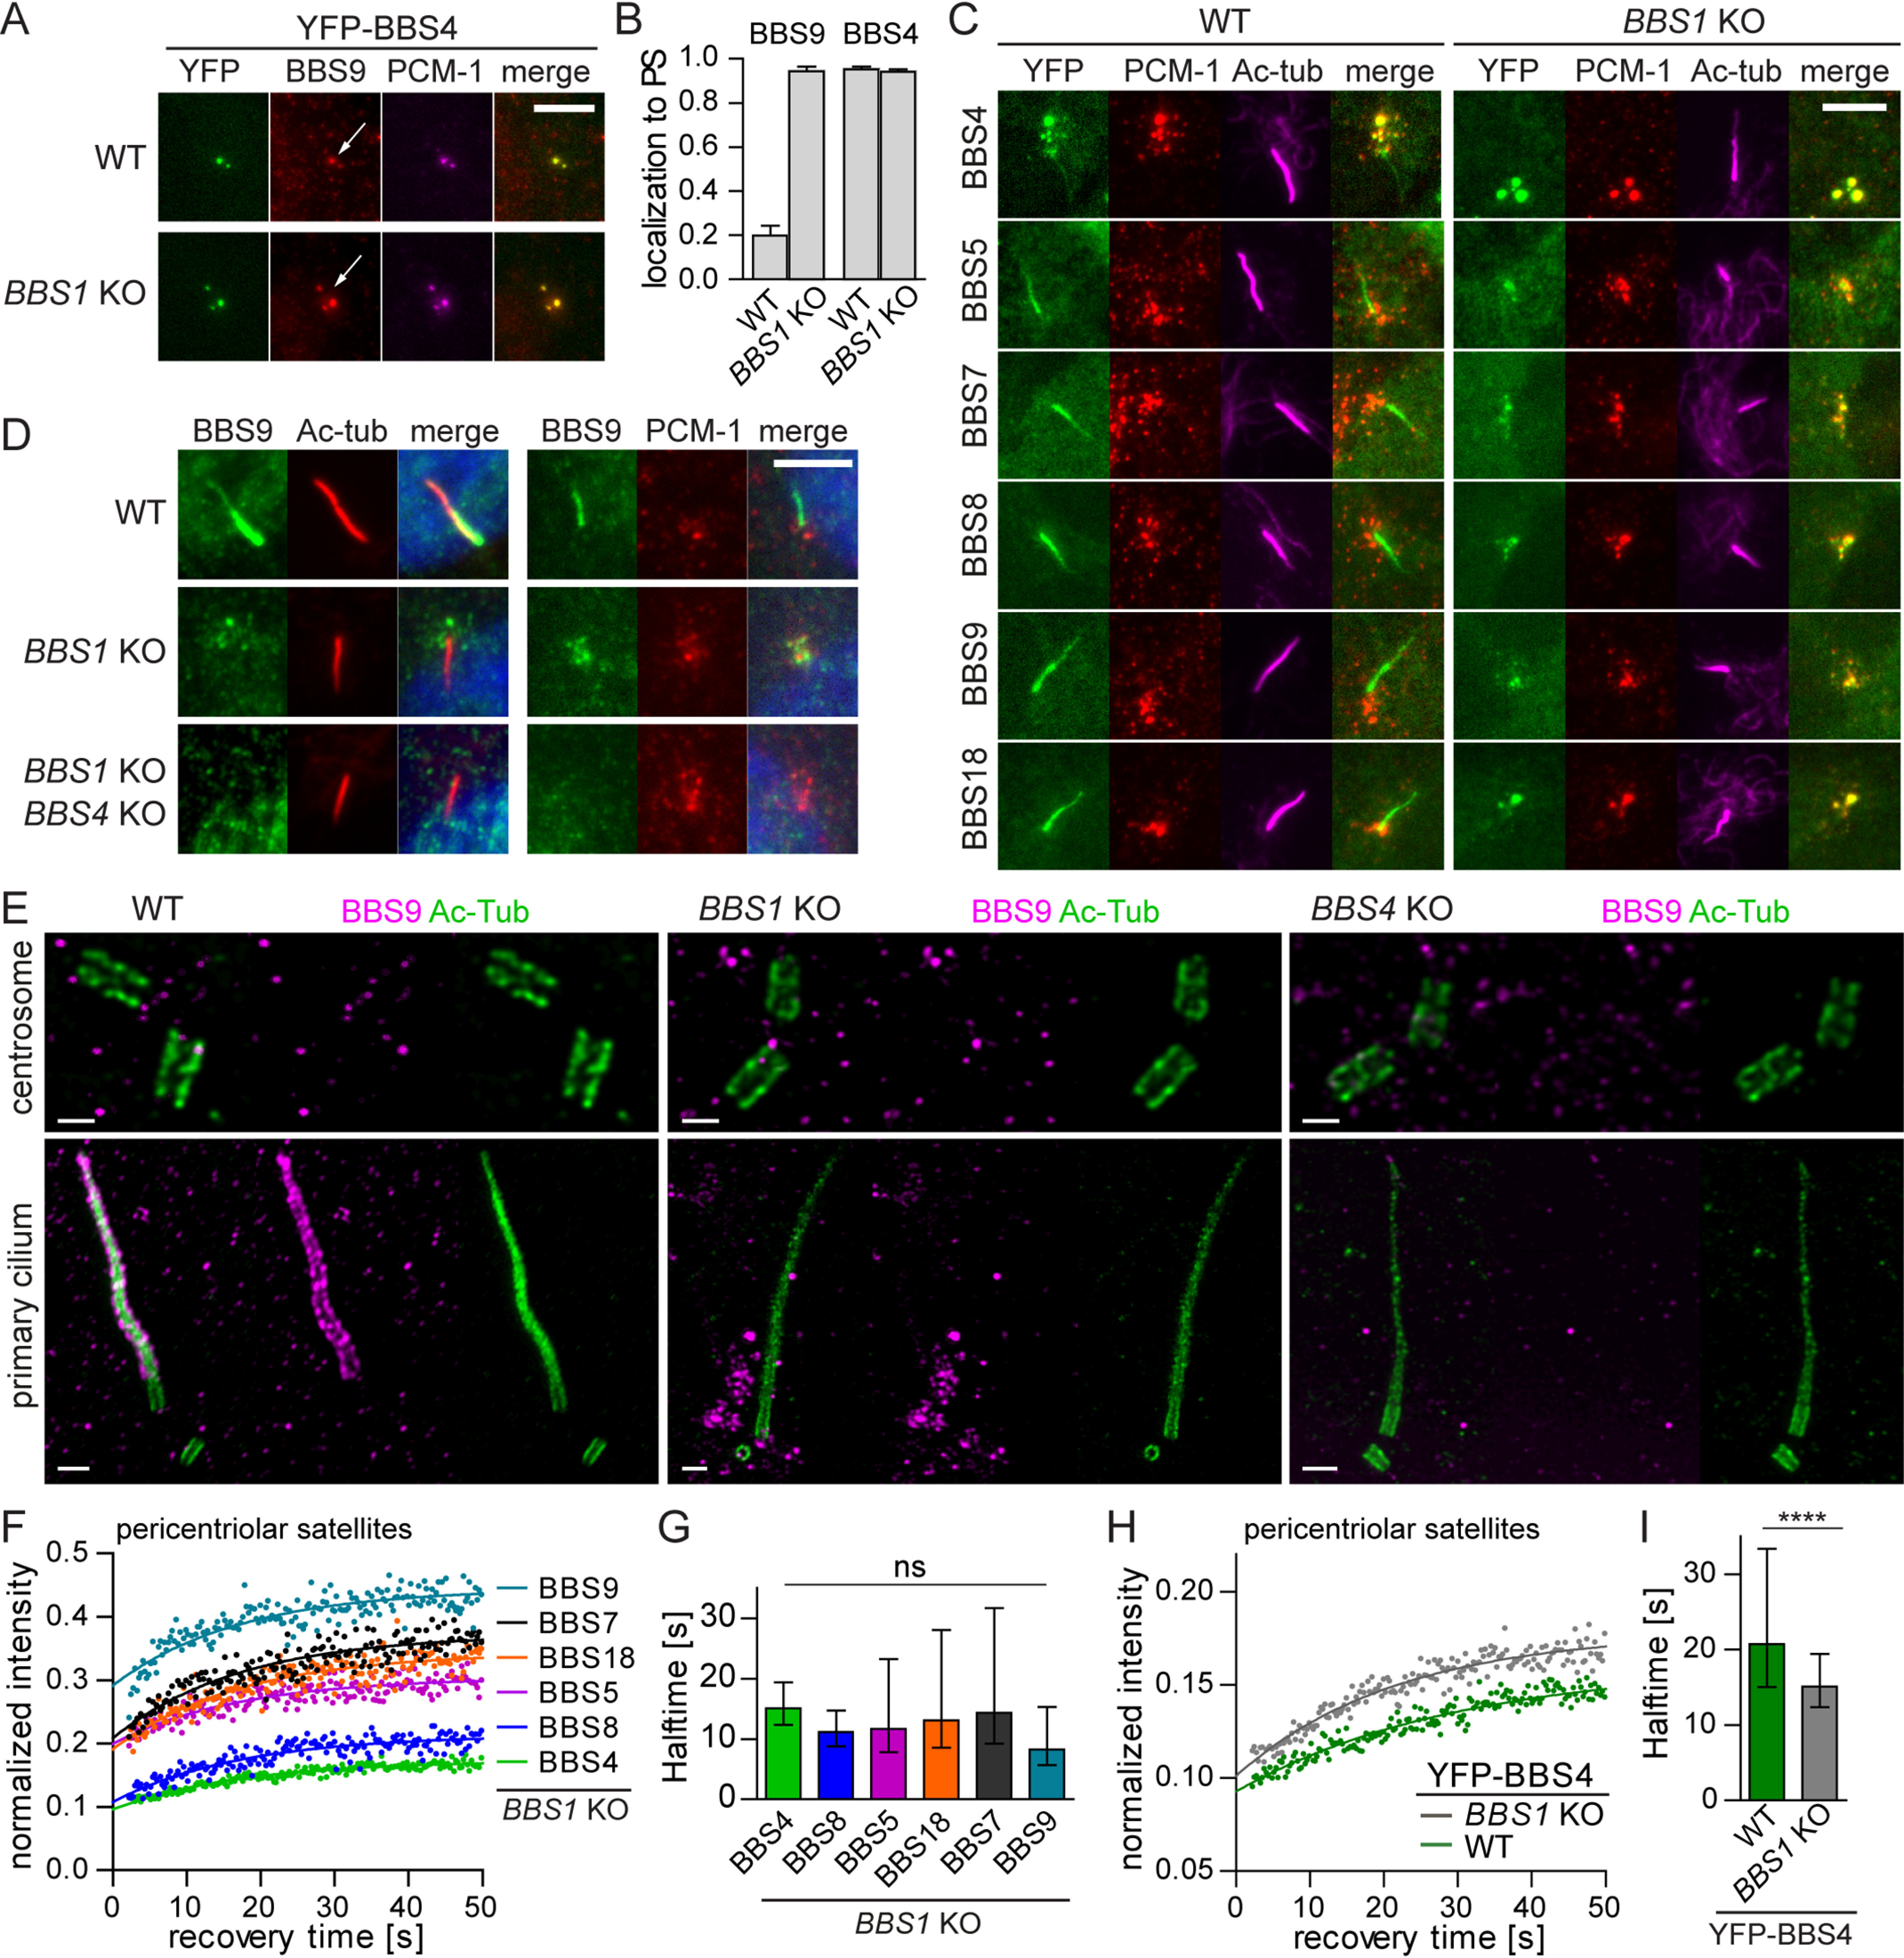
Loss of BBS1 stalls the pre-BBSome at the pericentriolar satellites. A, YFP-BBS4 along with endogenous BBS9 localize to the PS both in WT and BBS1 KO RPE1 cells (white arrows). BBS9 localization at the PS is pronounced in the BBS1 KO RPE1 cells compared with WT RPE1 cells. Antibody against PCM-1 was used to mark the PS. Scale bar, 5 μm. B, quantification of localization of YFP-BBS4 and endogenous BBS9 to the PS in WT and BBS1 KO RPE1 cells. Means and S.D. of two and three independent experiments, respectively, are shown. C, YFP-tagged BBSome subunits localize to the primary cilia (Ac-tub) in WT RPE1 cells but are accumulated at the PS (PCM-1) in BBS1 KO RPE1 cell lines. Scale bar, 5 μm. D, endogenous BBS9 localizes to the primary cilia (Ac-tub) and the PS (PCM-1) in WT and BBS1 KO RPE1 cells, respectively. Deletion of BBS4 on top of BBS1 deficiency results in BBS9 dispersal form PS to the cytoplasm. Scale bar, 5 μm. E, micrographs of BBS9 localization using expansion microscopy. BBS9 localizes to the cilia (Ac-tub) in WT RPE1 cells, around the ciliary base, and at the PS in BBS1 KO and is diffused in BBS4 KO. Scale bar, 2 μm. F, FRAP analysis of the dynamic turnover of the YFP-tagged BBSome subunits at the PS in BBS1 KO RPE1. Recovery curves were fitted at once using one-phase association fit. The mean of 20–30 measurements from three independent experiments is shown. Estimated half-times t½ and immobile fractions are shown in Table S4. G, bar graph depicts recovery half-times (s) of YFP-tagged BBSome subunits in BBS1 KO cell lines obtained from FRAP analysis in F. Means of 20–30 measurements from three independent experiments are shown. Error bars, 95% confidence interval. ns, not significant; p > 0.05. H, FRAP analysis of the dynamic turnover of the YFP-BBS4 at PS in WT and BBS1 KO RPE1 cells. Recovery curves were fitted using one-phase association fit. The mean of 20–30 measurements from three independent experiments is shown. Estimated half-times t½ and immobile fractions are shown in Table S4. I, bar graph depicts recovery half-times (s) of YFP-BBS4 in WT and BBS1 KO cell lines obtained from FRAP analysis in H. Means of 20–30 measurements from three independent experiments are shown. Error bars, 95% confidence interval. The statistically significant difference was calculated by Mann–Whitney test. ****, p < 0.0001.
