Figure 5.

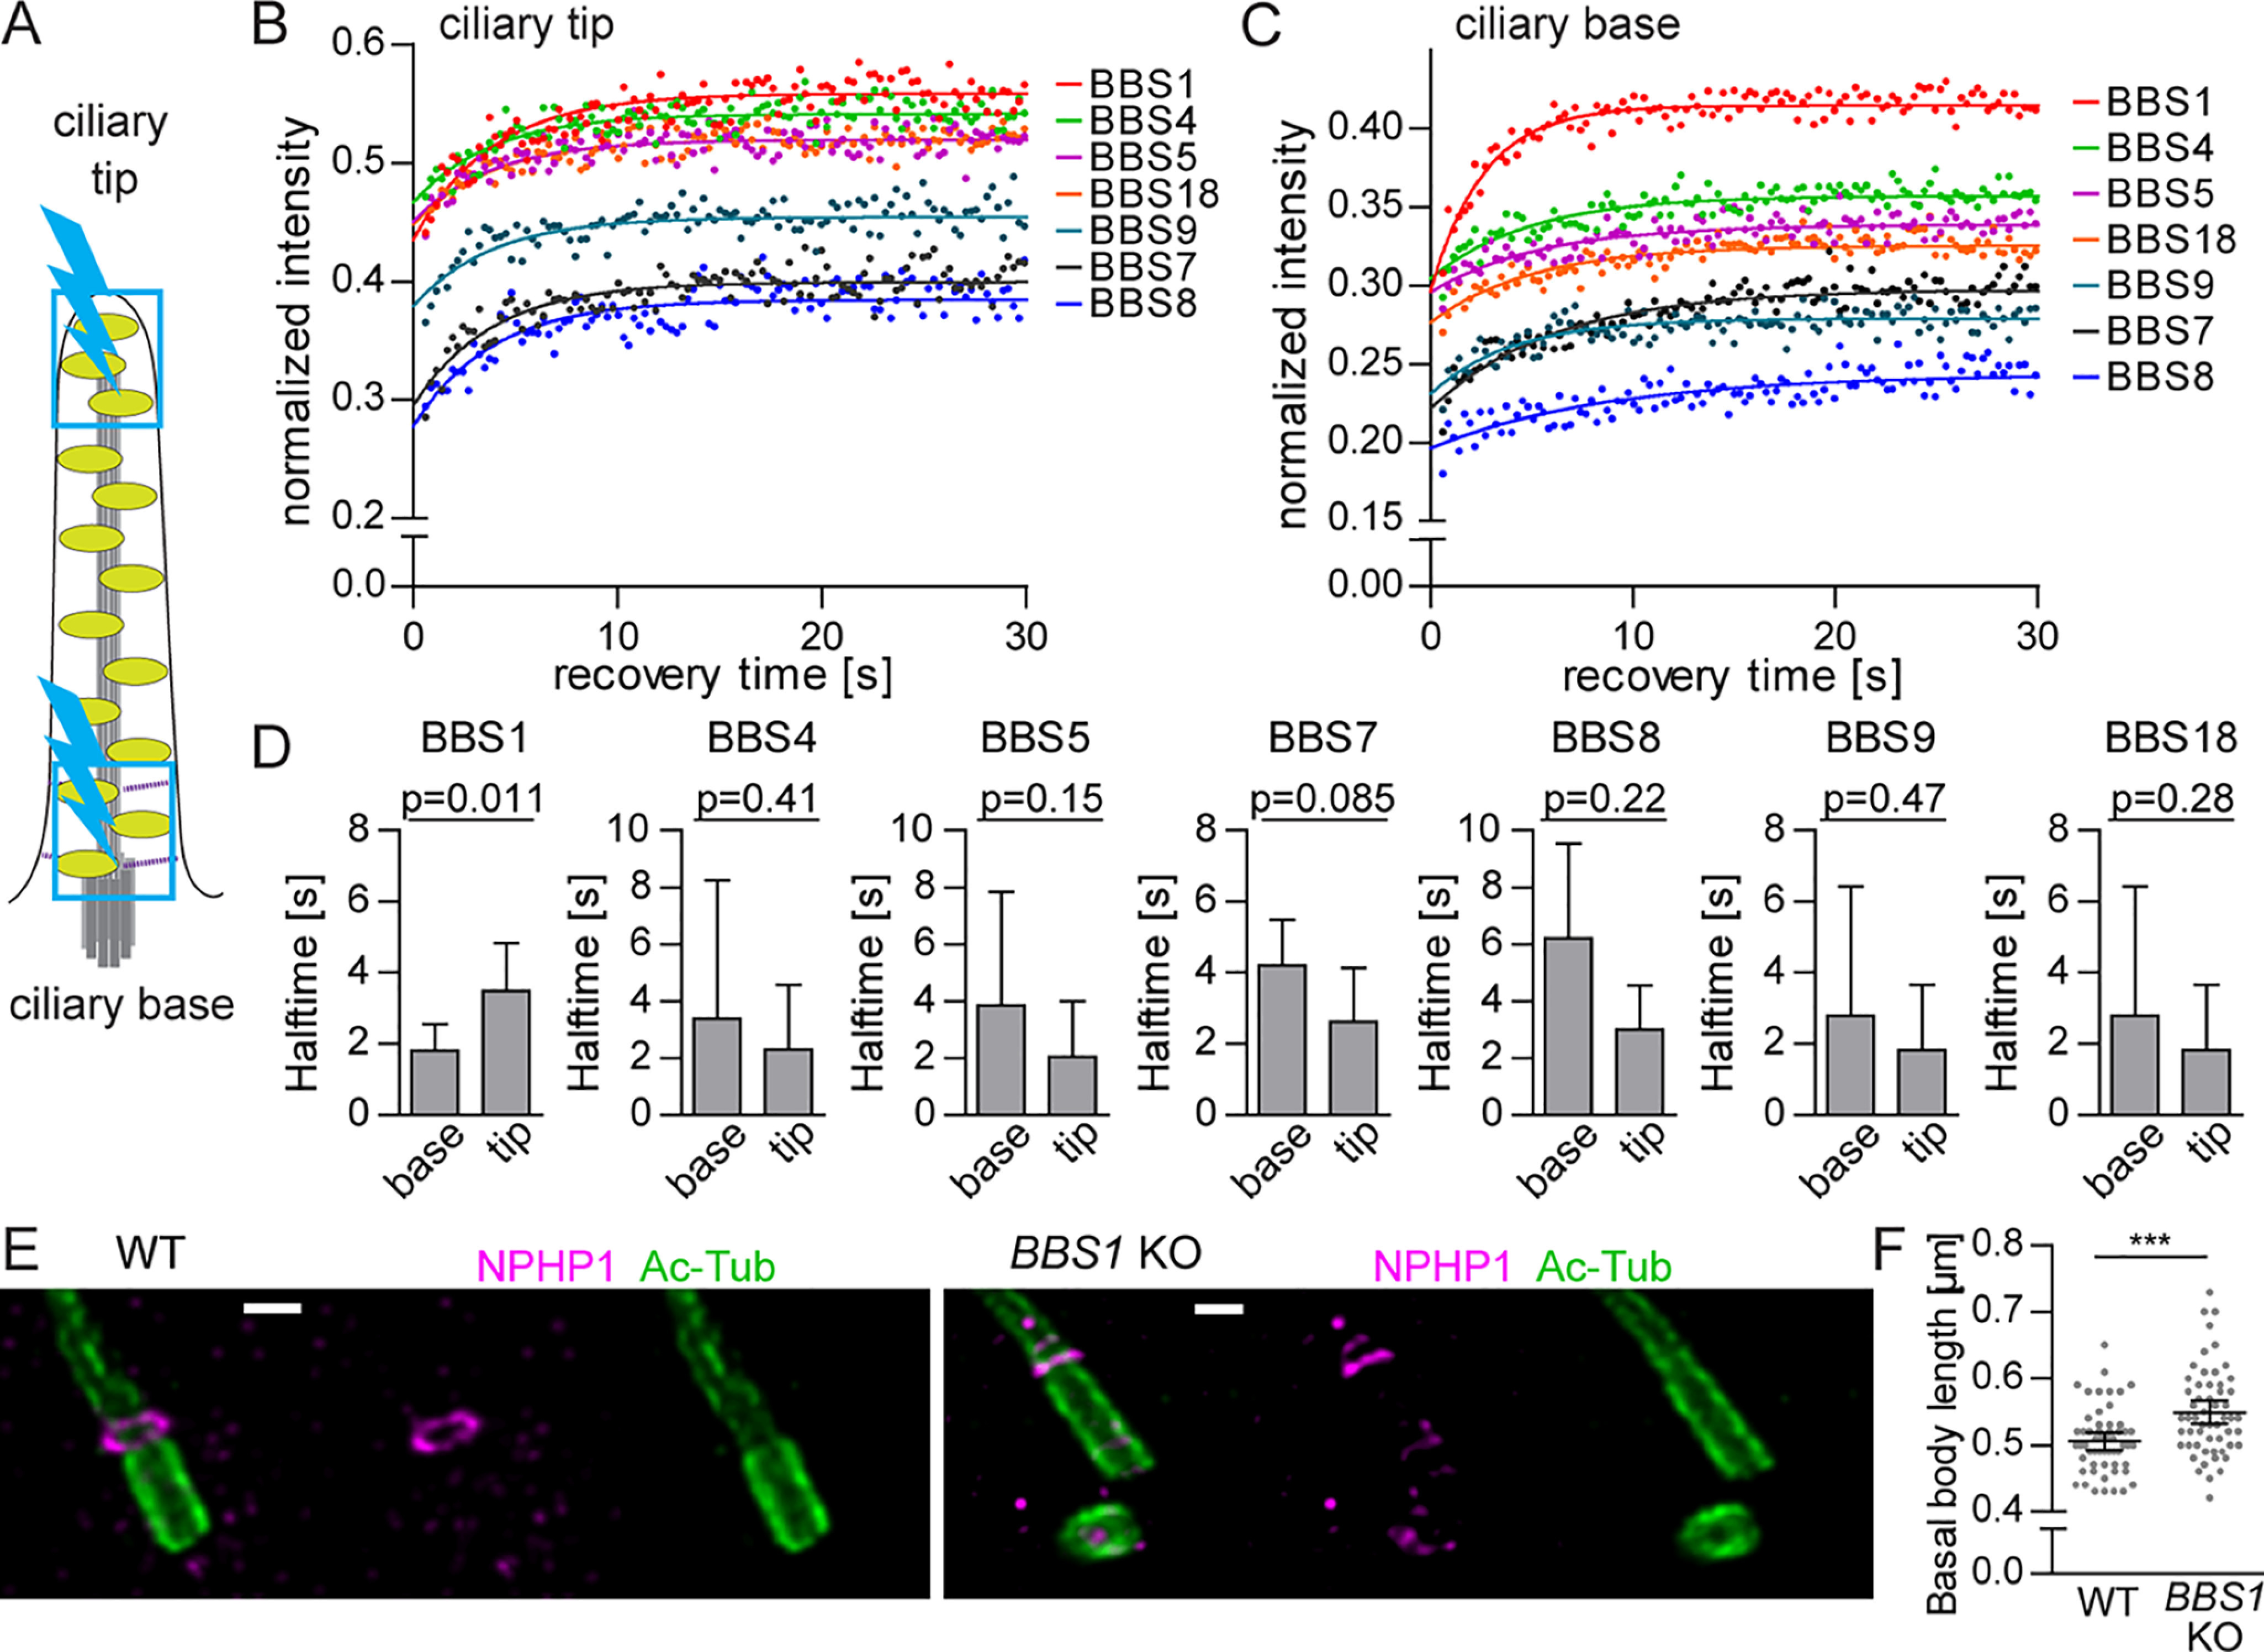
BBS1 has a distinct dynamic behavior at ciliary base. A, schematic representation of the FRAP experiment in the primary cilia. Ciliary base and tip (blue boxes) were bleached for 0.3 s using a 20-milliwatt 488-nm solid-state laser at 100% intensity (blue lightning bolt). B and C, FRAP analysis of the dynamic turnover of the YFP-tagged BBSome subunits at the ciliary base (B) and tip (C). FRAP curves were fitted with one-phase association fit. Means of 20–30 measurements from three independent experiments are shown. Estimated half-times t½ and immobile fractions are shown in Table S5. D, bar graphs depict the recovery half-times of BBSome subunits at the ciliary tip and base. Means of 20–30 measurements from three independent experiments are shown. Error bars, 90% confidence interval. E, micrographs of basal body (Ac-tub) and transition zone (NPHP1) staining in WT and BBS1 KO RPE1 cells using expansion microscopy. Scale bar, 2 μm. F, plot of the basal body lengths quantified based on the expansion microscopy performed in WT and BBS1 KO cell lines in E. BBS1 KO cells have significantly longer basal bodies compared with WT. Statistical significance was calculated using two-tailed Mann–Whitney test. Means with S.D. (error bars) of n = 56 are shown. ***, p < 0.001.
