Figure 6.
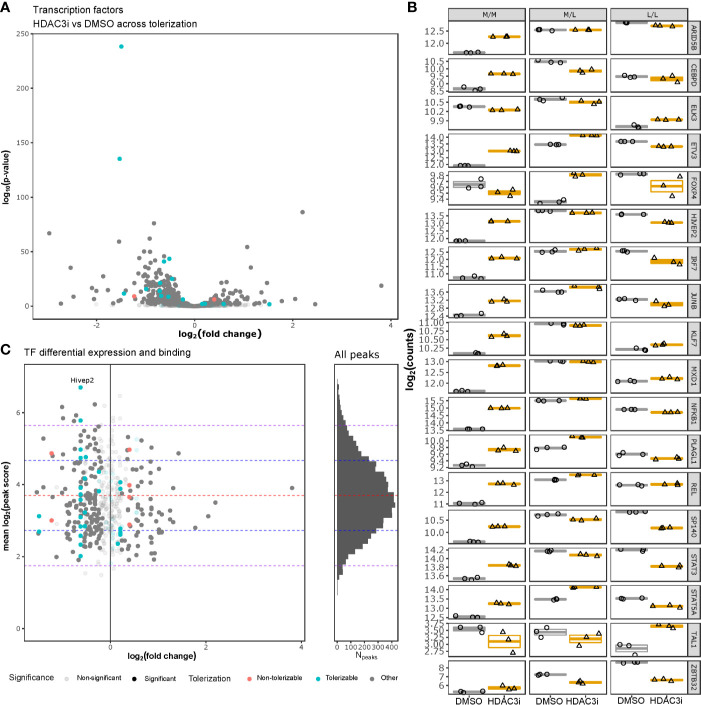
HDAC3i-treatment effect on transcription factors. Gene expression of human tolerizable TFs across the non-tolerized and tolerized states was interrogated and compared with HADC3 binding in mice macrophages. (A) Gene expression of tolerizable human TFs, obtained from Foster et al., 2007 and Lambert et al., 2018, respectively, were presented as a volcano plot with the log2 fold-change on the x-axis and the –log10(p-value) on the y-axis. (B) The expression in log2(counts) on the y-axis of the significantly differentially expressed TFs (ARID5B, CEBPD, ELK3, ETV3, FOXP4, HIVEP2, IRF7, JUNB, KLF7, MXD1, NFKB1, PLAGL1, REL, SP140, STAT3, STAT5A, TAL1 and ZBTB32) for M/M, M/L and L/L macrophages, pretreated either with DMSO or HDAC3i. (C) Overlap of the differentially expressed tolerizable TFs with the HDAC3-bound TFs in mouse BMDMs as obtained from GSE106701 samples GSM2845618 and GSM2845619. The x-axis represents the log2(fold change), while the y-axis represents the mean log2(MACS peak score). Histogram on the right represents the mean log2(MACS peak score) distribution (y-axis) for all the HDAC3-binding regions reported by Czimmerer et al. x-axis represents number of peaks (Npeaks). The red, blue and purple dashed horizontal lines represent the mean, first and second standard deviations, respectively.

