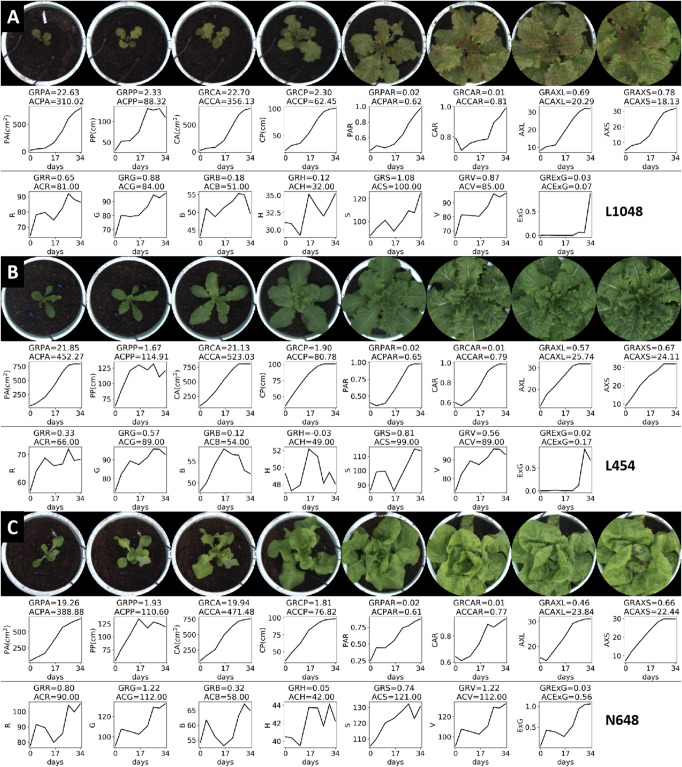
FIGURE 7.
Top-view image sequence and dynamic traits of three lettuce varieties. For the three varieties, 15 static traits were collected from each plant, with corresponding line charts showing the changes in these traits over a 34-day period, and dynamic traits (GR-, AC-) were used to quantify these changes.

