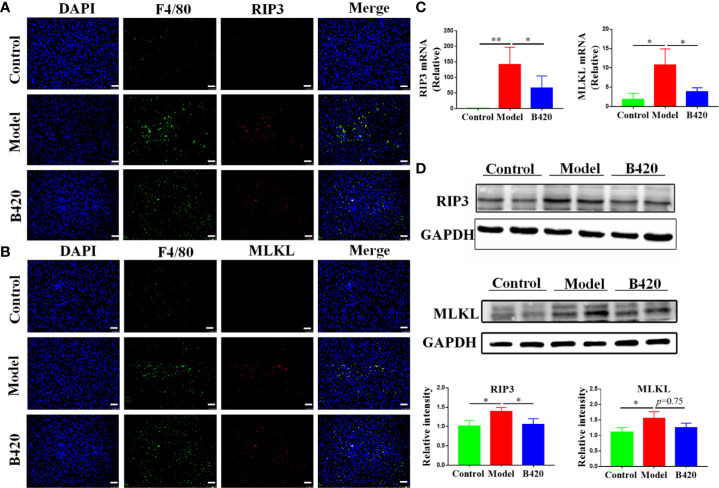
Figure 6.
B420 inhibited the RIP3 signaling pathway of liver macrophages in EAH mice (A) Representative fluorescence images of liver tissues co-stained with F4/80 and RIP3. F4/80 (green), RIP3(red), DAPI (blue). (B) Representative fluorescence images of liver tissues co-stained with F4/80 and MLKL. F4/80 (green), MLKL (red), DAPI (blue). (C) Total RNA was extracted from the liver tissues for real-time PCR analysis. The relative expressions of RIP3 and MLKL were shown. (D) Protein levels of RIP3 and MLKL in the liver tissues from each group were detected by western blotting and the relative intensity was measured. In (A–D), n=6 in each group. Scale bar: 50μm. The data were presented as means ± SD (Student’s t-test, *p < 0.05, **p < 0.01).

