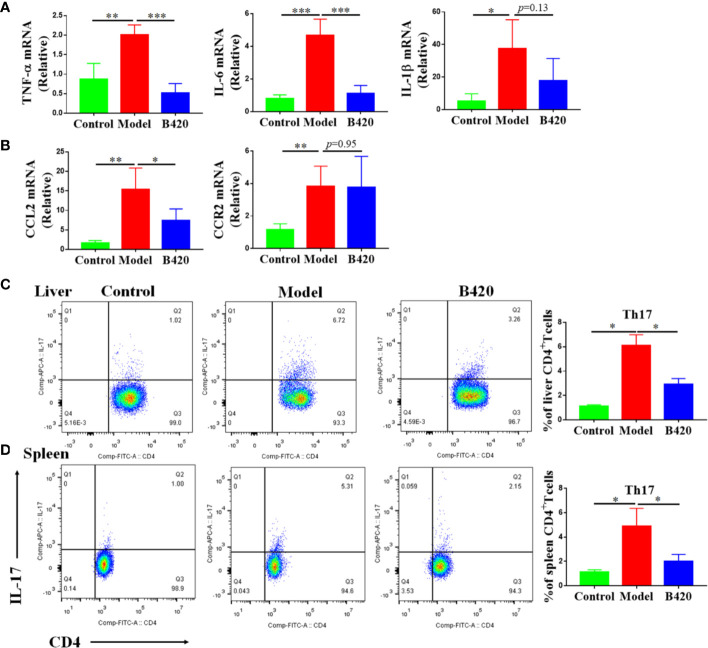
Figure 7.
B420 regulated pro-inflammation cytokines and chemokines in liver as well as Th17 cells in liver and spleen. Total RNA was extracted from the liver tissues for real-time PCR analysis and mononuclear lymphocytes were isolated from liver and spleen, counted and stained with cell markers to identify Th17 cells. (A) The relative expressions of TNF-α, IL-6 and IL-1β in liver tissues were analyzed by real-time PCR. (B) The relative expressions of CCL2 and CCR2 mRNA in liver tissues were detected. (C) Typical CD4+IL-17+ Th17 cells flow cytometric plots and the percentage of Th17 cells out of the liver CD4+population were calculated. (D) Representative flow cytometry plots and the percentage of Th17 cells out of the spleen CD4+population were calculated. In (A–D), n=6 in each group. The data were presented as means ± SD (Student’s t-test, *p < 0.05, **p < 0.01, ***p < 0.001).

