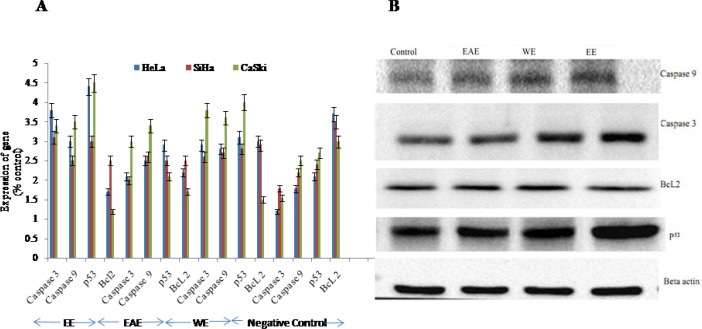
Figure 4.
Expression of Genes Analyzed by Western Blotting Assay of the HeLa. SiHa nad CaSki cells treated by EE, EAE, WE and compared with Negative Control. A. The intensity of protein bands of expressed genes measured by Image J software. Standard error (SE±) bar inserted (p<0.05), B. Bands of proteins of CaSki cells in Western blotting after treatment with EE, EAE and WE (150 μg/mL in each)

