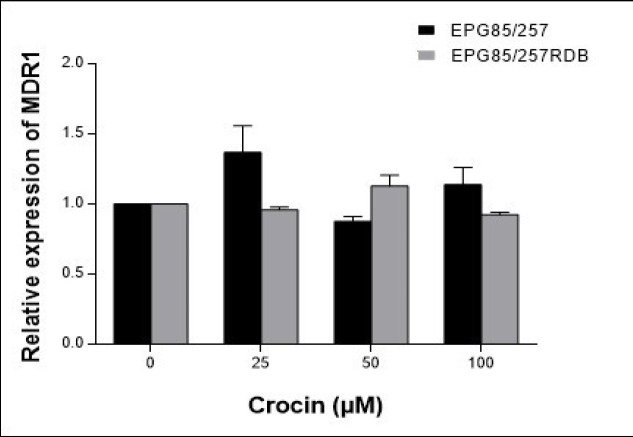
Figure 3.
The Effects of Crocin on the MDR1 mRNA Expression Levels in the EPG85-257 and EPG85-257RDB Cell Lines. Cells were treated for 48 h with crocin (0–100 μM), and MDR1 gene expression was measured by real-time RT-PCR using total RNA extracted from control and treated cells. Values were normalized to the β-actin content of each samples. The results were expressed as the ratio of target/reference of the treated samples divided by the ratio of target/reference of the untreated control sample and expressed as mean ± SEM (n = 4).

