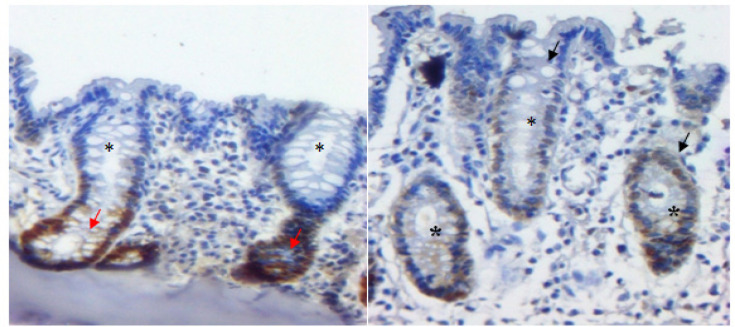
Figure 3.
Colon Photomicrographs Marked with PCNA and Developed with DAB. Crypt cells in the basal region of the crypt (red arrow) and crypt apex in experimental groups (GII, GIII and GIV) (black arrow) with marked expression of PCNA, presence of nuclear stratification and reduced mucin production (*).

