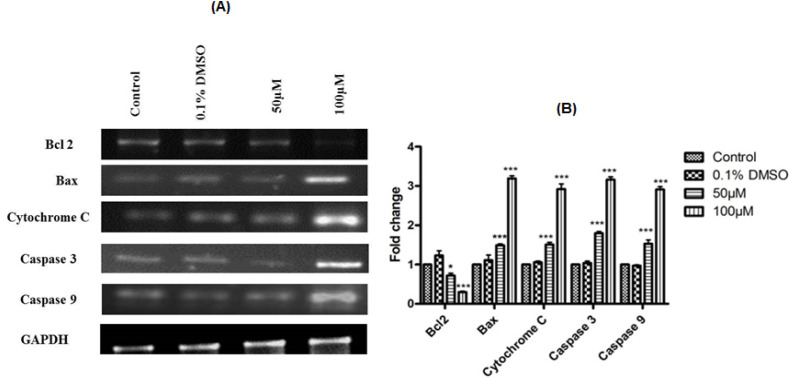
Figure 3.
(A), Silibinin effect on the apoptotic marker genes expression; (B), Quantification of gene expression. Values are expressed as mean ± S.E.M (n=3). Comparisons were done by Bonferroni’s post-hoc comparison test. GAPDH used as an internal control for optimization. * p < 0.05; *** p < 0.001 vs control

