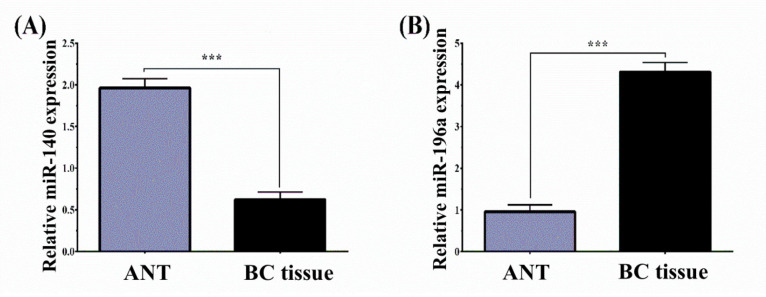
Figure 1.
MiR-140 and miR-196a Expression Levels of 110 BC and ANT Tissues Normalized to U6 Analyzed by Using qRT-PCR. The results represent that (A) miR-140 was downregulated in BC compared to that in ANT group (BC vs. ANT: 0.623 ± 1.07 vs 1.74 ±1.393, P< 0.001) and (B) miR-196a was upregulated in BC compared to that in ANT group (BC vs ANT: 4.31 ± 2.55 vs 2.77 ± 2.45, ***P< 0.001). BC, Breast cancer; ANT, Adjacent non‐tumor; qRT-PCR, Real-Time Quantitative Reverse Transcription PCR

