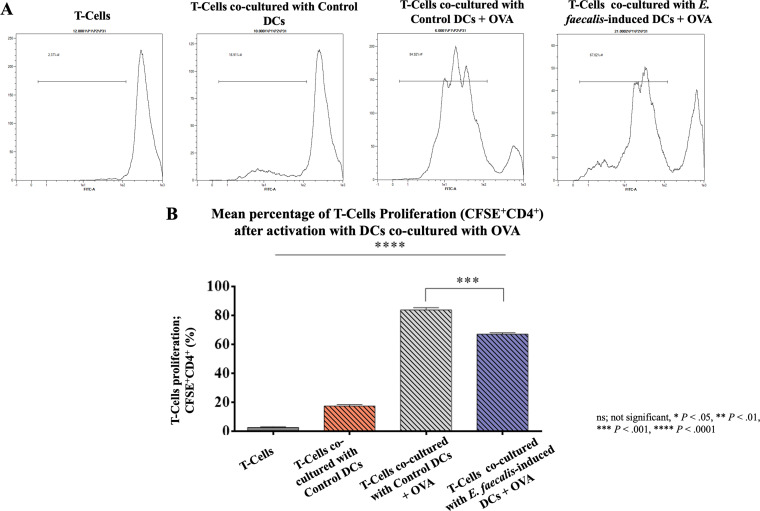
FIG 6.
Immunosuppressive effect of E. faecalis-induced DCs on OVA-specific T cell proliferation. (A) Histograms showing the peaks of CFSE+ CD4+ T cells after coculture with control DCs, with control DCs plus OVA, or E. faecalis-induced DCs plus OVA. Proliferation indicated by peaks shifted to the left. (B) Mean percentage proliferation of CD4+ T cells, ± standard errors (SEs). Results are representative of three separate experiments performed in triplicates.

