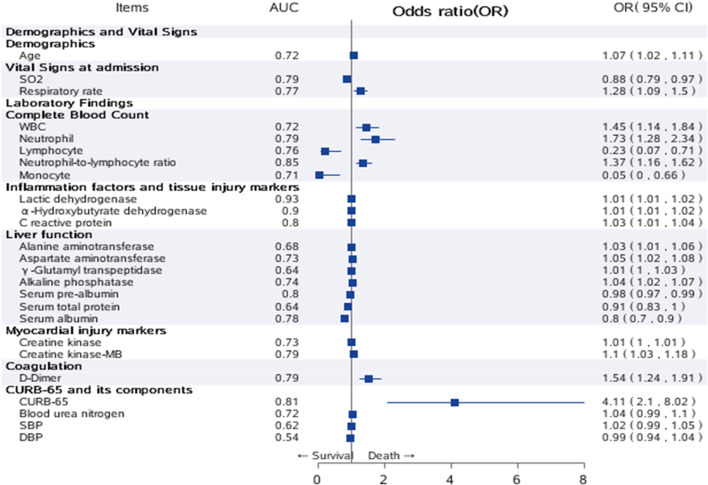
Fig. 3.
Univariate analysis of risk factors for in-hospital death. Significant variables in univariate analysis were plotted as a forest plot. The second column listed the AUC of all risk factors, the third column listed OR and 95% CI for all risk factors. Note: Those factors with extremely wide CI were ignored in the plot.

