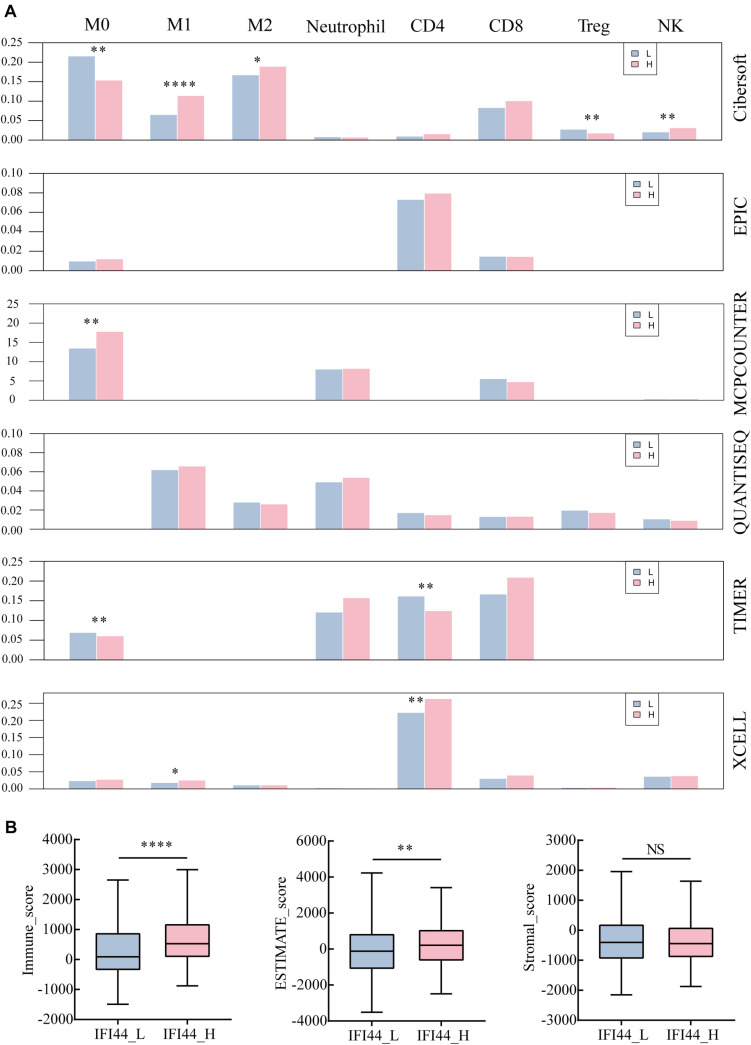
FIGURE 5.
The different immune infiltration in IFI44-high expression group and IFI44-low expression group. (A) The immune infiltration of analysis across six databases between IFI44-high expression group (n = 261) and IFI44-low expression group (n = 261). M0 (macrophage M0), M1 (macrophage M1), M2 (macrophage M2), CD4 (CD4+ T cell), CD8 (CD8+ T cell), Tregs (regulatory T cells), NK (natural killer cell). (B) The immune infiltration score including immune score, stromal score, and estimate score in IFI44-high expression group (n = 261) compared with IFI44-low expression group (n = 261). The analysis was conducted in ESTIMATE database (*P < 0.05; **P < 0.01; ***P < 0.001; ****P < 0.0001).

