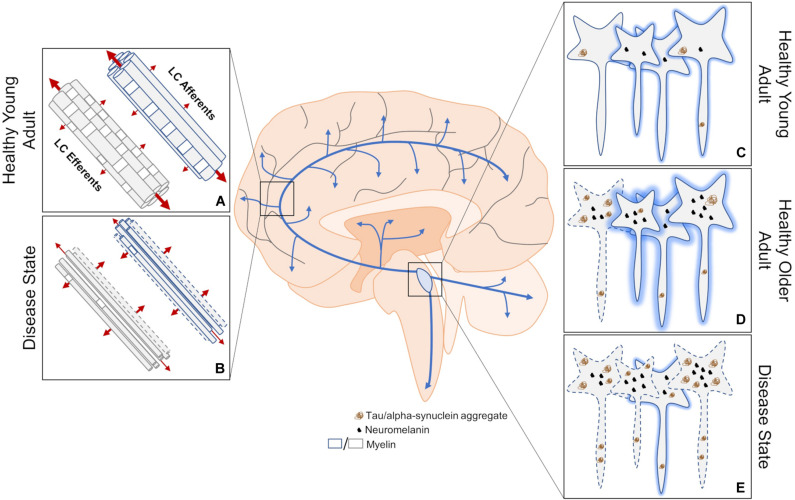
FIGURE 1.
An overview of structural MRI approaches to investigating changes in LC dysfunction in neurodegenerative disorders. (A) DTI measures three-dimensional diffusion of water molecules (red arrows where thickness of the arrow represents weight of diffusion) to get readouts of axonal health. Water molecules tend to diffuse along, rather than across, healthy myelinated axons. (B) This structural imaging method has been used to determine changes in innervation, myelination, and axon size between the LC and downstream brain regions in disease states, but cannot distinguish between deficits in efferent or afferent connections. (C) Contrast thought to arise from neuromelanin, high water proton density, and/or other mechanisms allow the LC to be visualized using structural MRI. (D) LC contrast appears to peak in adulthood, which is correlated with neuromelanin levels. At this stage, some hyperphosphorylated tau may be apparent. (E) A decrease in LC contrast is thought to represent compromised LC integrity during disease states, but has yet to be attributed to cell or dendritic field loss. Neurodegeneration may result from the aggregation of hyperphosphorylated tau. Dashed lines indicate degenerating neurons and shading represents relative contrast from each neuron. Blue arrows represent LC-NE release sites throughout the brain and spinal cord.

