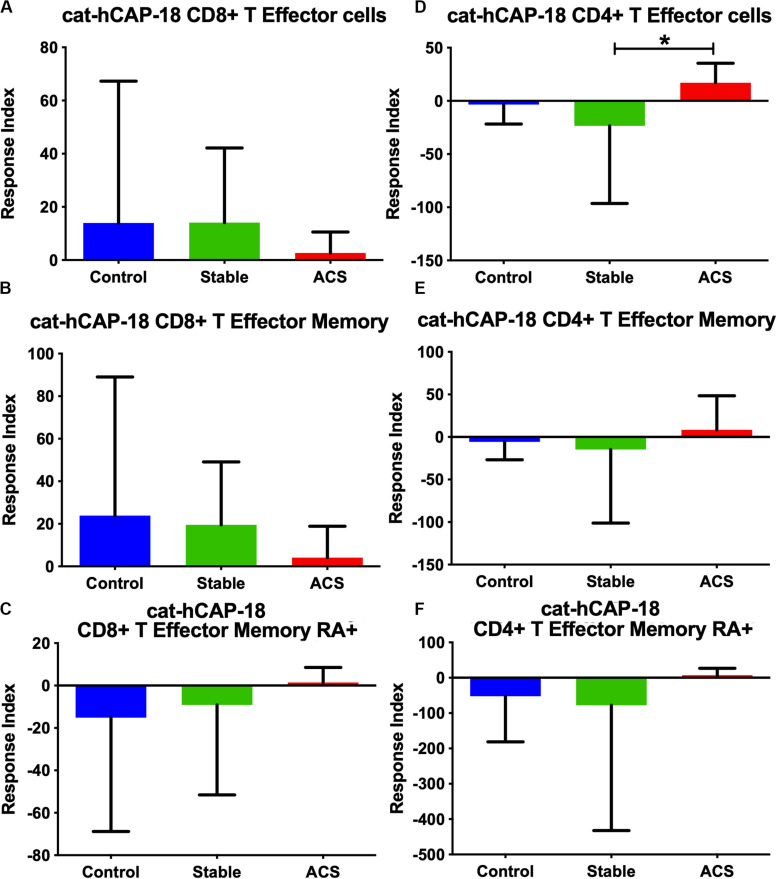
FIGURE 3.
PBMC T Effector cell response to stimulation with the cathelin domain of the human proprotein hCAP-18, cat-hCAP-18. CD8+ (A–C) and CD4+ (D–F) Memory T cell responses to stimulation of peripheral blood mononuclear cells from self-reported controls (Control), stable coronary artery disease (Stable), and acute coronary syndrome patients (ACS). T Effector Memory (B,E) and T Effector Memory RA+ (C,F) were based on CD45RO/CD45RA flow cytometric stain as detailed in the gating scheme described in Supplementary Figure 1. Control N = 15; Stable CAD N = 10; ACS N = 9; *P < 0.05 Stable vs ACS. Kruskal-Wallis and Dunn’s multiple comparisons test.

