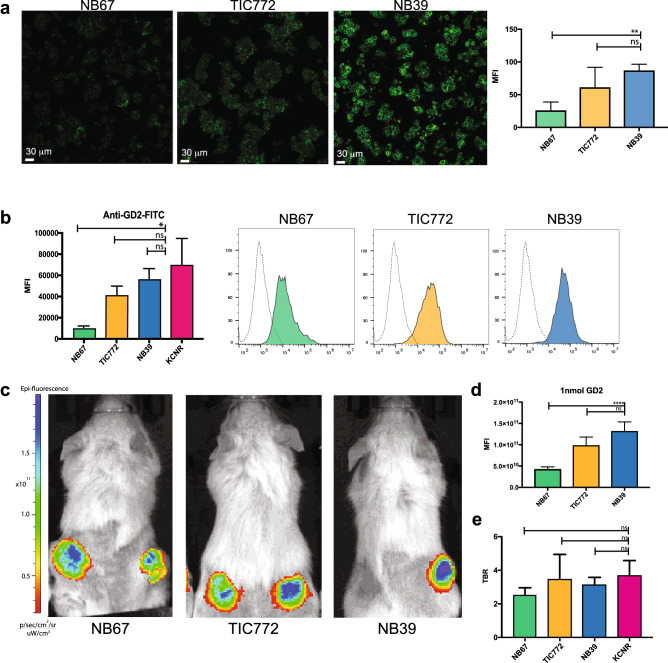
Figure 6.
Patient-derived organoid lines representing heterogeneous GD-2 expression demonstrate adequate florescent signal in case of low GD2 expression. (a) Representative confocal images of the three different patient-derived NB organoid lines NB67, TIC772 and NB39 showing anti-GD2 staining at different intensities. Graphs (right panel) depict mean intensities + SEM, **p = 0.0028 for comparison of NB67 and NB39 and non-significant (ns) (p = 0.2365) for comparison TIC772 and NB39. (b) Accumulative data (left panel) and representative histograms (right panel) of anti-GD2-IRDye800CW staining analysed by flow cytometry. MFI + SEM *p = 0.05 for comparison of NB67 and KCNR, and non-significant (ns) for comparison TIC772 to KCNR (p = 0.3429) and NB39 to KCNR (p = 0.4857). (c) Representative in vivo images from patient-derived organoid xenograft models. (d) MFI for all concentrations in arbitrary units. Mean ± SEM. ****p < 0.001 for comparison of 1 nmol dose anti-GD2-IRDye800CW of NB67 to NB39 and non-significant (ns) for comparison of NB67 to NB39 p = 0.06 (e) TBR at day 4 of mice receiving anti-GD2-IRDye800CW. The TBRs of all organoid lines were non-significant (ns) when compared to the TBR of the KCNR cell line (p = 0.07 for comparing KCNR to NB67, p = 0.257 when comparing KCNR to NB39 and p > 0.999 when comparing TIC772 to KCNR).

