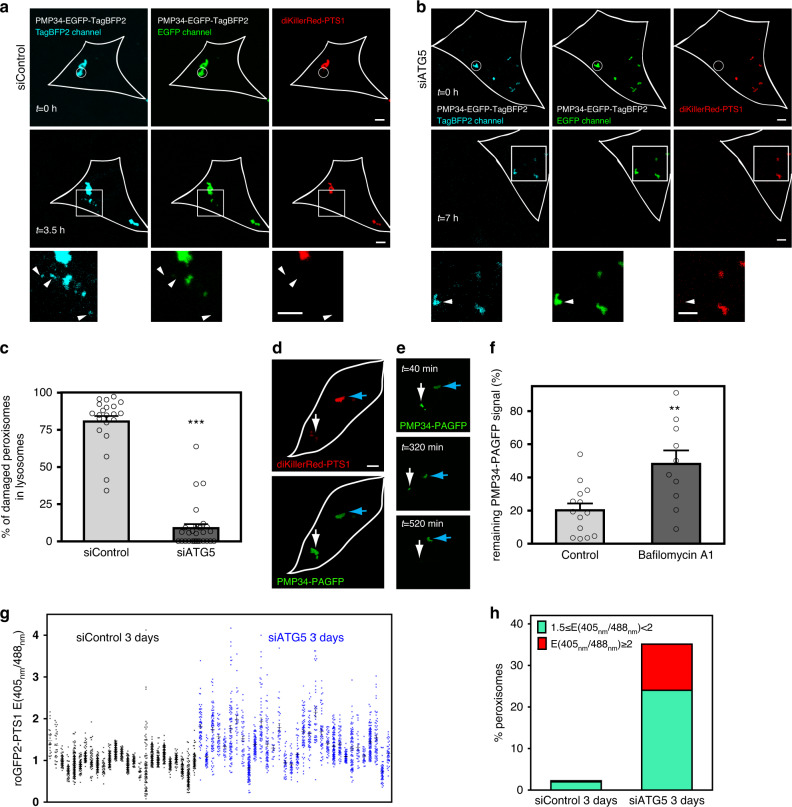
Fig. 2. ROS-stressed peroxisomes are removed by macroautophagy.
a Peroxisomes within the white circular region in a NIH3T3 cell expressing PMP34-EGFP-TagBFP2 and diKillerRed-PTS1 were illuminated with 559 nm light (top panels). Middle panels: the same cell 3.5 h after illumination. Bottom panels: magnified view of the white square region in the middle panels. The white arrows indicate the eventual loss of EGFP fluorescence on damaged peroxisomes. b The experiment in a was similarly carried out on a NIH3T3 cell transfected with a siRNA targeting ATG5. c The percentage of ROS-stressed peroxisomes that entered lysosomes (TagBFP2+ EGFP−) 7 h, following 559 nm illumination (siControl, n = 21 cells; siATG5, n = 28 cells; ***P = 1.41E−20, one-tailed t test). All error bars represent the mean + SEM. d–f NIH3T3 cells expressing diKillerRed-PTS1 and PMP34-PAGFP were 405 nm light illuminated to activate the whole-cell PMP34-PAGFP fluorescence. The eventual loss of PMP34-PAGFP signal was taken to indicate the delivery of peroxisomes into lysosomes for turnover. d, e ROS-stressed (559 nm light, white arrow) peroxisomes turned over much faster than non-stressed ones (blue arrow, n = 10 cells). d A NIH3T3 cell right after 559 nm light illumination. e The cell in d 40, 320, and 520 min after 559 nm light illumination. f The percentage of PMP34-PAGFP intensities remaining from ROS-stressed peroxisomes 8 h following 559 nm illumination were calculated. Bafilomycin A1 treatment delayed cellular turnover of ROS-stressed peroxisomes (n = 14 and 10 cells). All error bars represent the mean + SEM. **P = 0.0014 (one-tailed t test). All scale bars, 5 µm. g, h The redox sensor roGFP2-PTS1 was used to assay if ATG5 depletion results in cellular accumulation of ROS-stressed peroxisomes. g roGFP2-PTS1 emission ratios between 405 and 488 nm excitation. Each dot represents one peroxisome, and a column denotes all peroxisomes within a single cell. The ratios in ATG5-depleted cells vs. those in control cells 72 h after depletion are shown. h Graph tabulating the percentage of peroxisomes in g with roGFP2-PTS1 emission ratios between 1.5–2 (green) and ≧2 (red). siControl: n = 25 cells; siATG5: n = 32 cells. All scale bars, 5 µm. Source data are provided as a Source data file.

