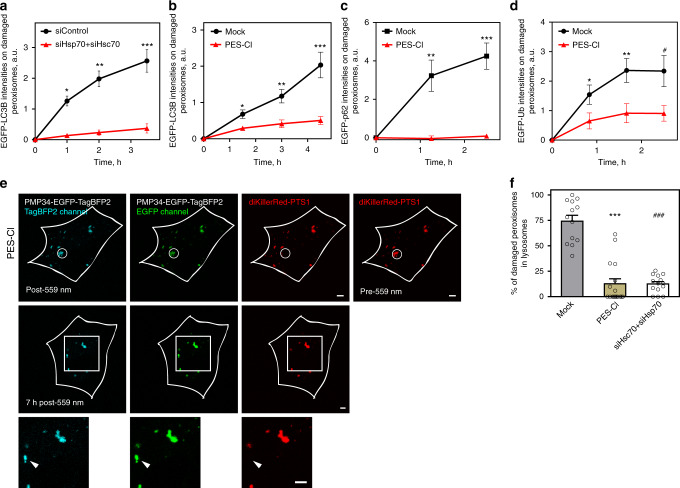
Fig. 6. Inhibiting Hsc70/Hsp70 blocks pexophagy.
a Quantifying LC3B accumulation on ROS-stressed peroxisomes (as in Fig. 1h–j). Depletion of cellular Hsc70 and Hsp70 delayed LC3B appearance on ROS-stressed peroxisomes (x-axis represents time after 559 nm illumination; siControl, n = 8 cells; siHsp70 + siHsc70, n = 18 cells). *P = 4.25E−09, **P = 8.32E−09, ***P = 3.22E−07 (one-tailed t test). b Hsp70/Hsc70 inhibition on LC3B accumulation. Treating cells with PES-Cl delayed LC3B appearance on ROS-stressed peroxisomes (Mock, n = 10 cells; PES-Cl, n = 14 cells). *P = 0.0011, **P = 0.0004, and ***P = 3.89E−05 (one-tailed t test). c Inhibiting Hsc70/Hsp70 with PES-Cl delayed EGFP-p62 accumulation on ROS-stressed peroxisomes (Mock, n = 9 cells; PES-Cl, n = 10 cells). **P = 0.0018 and ***P = 0.0001 (one-tailed t test). d PES-Cl treatment delayed EGFP-Ub accumulation on ROS-stressed peroxisomes (Mock, n = 11 cells; PES-Cl, n = 15 cells). *P = 0.0227, **P = 0.0046, and #P = 0.0071 (one-tailed t test). All error bars in a–d represent mean ± SEM. e Same experimental setup as Fig. 2a, b, but with PES-Cl treatment. Peroxisomes within the white circular region in a NIH3T3 cell expressing PMP34-EGFP-TagBFP2 and diKillerRed-PTS1 were illuminated with 559 nm light (top panels). The EGFP and TagBFP2 signals of 559 nm illuminated peroxisomes were monitored 7 h after illumination (middle panels). The white arrows indicate that EGFP fluorescence persisted on ROS-stressed peroxisomes (bottom panels; magnified view of the white square region in middle panels). f The percentage of peroxisomes that entered lysosomes (TagBFP2+ EGFP−) 7 h following 559 nm illumination (Mock, n = 13 cells; PES-Cl, n = 17 cells; siHsc70 + siHsp70, n = 14 cells. ***P = 3.67E−09, ###P = 1.56E−08, one-tailed t test). All error bars represent the mean + SEM. All scale bars: 5 μm. Source data are provided as a Source data file.

