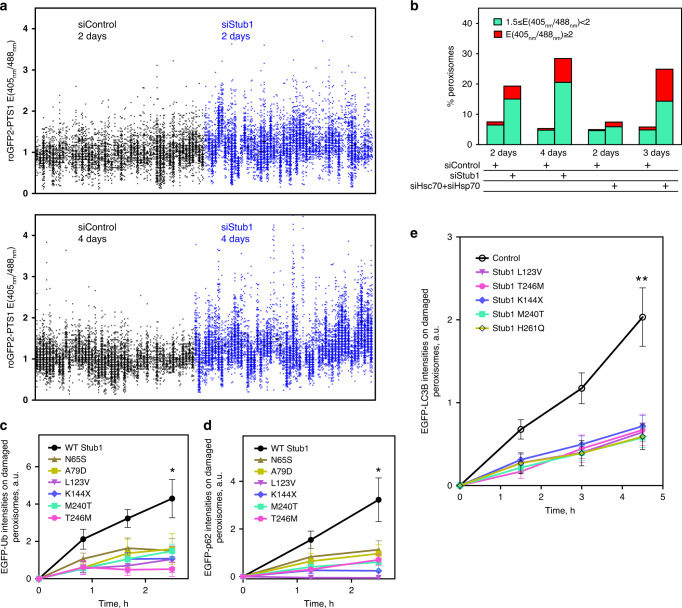
Fig. 7. Ataxia-related Stub1 mutants affect peroxisomal ROS-mediated pexophagy.
a, b We assayed if Stub1 depletion affected peroxisome quality using NIH3T3 cells expressing a peroxisomal redox sensor roGFP2-PTS1. a roGFP2-PTS1 emission ratios between 405 and 488 nm excitation. Each dot represents one peroxisome, and a column denotes all peroxisomes within a single cell. The ratios in Stub1-depleted cells vs. those in control cells are shown (top: 48 h after depletion; bottom: 96 h after depletion). b Graph tabulating the percentage of peroxisomes with roGFP2-PTS1 ratios between 1.5–2 (green) and ≧2 (red). c, d The effect of WT and Ataxia-related Stub1 mutant overexpression on ubiquitin and p62 recruitment onto ROS-stressed peroxisomes in Stub1 KO (NIH3T3) cells. Stub1 KO cells expressed EGFP-Ub (c) or EGFP-p62 (d), plus TagBFP-PMP34, diKillerRed-PTS1, and WT hStub1 or Ataxia-related Stub1 mutants tagged with TagBFP. c WT, n = 11 cells; N65S, n = 14 cells; A79D, n = 9 cells; L123V, n = 8 cells; K144X, n = 9 cells; M240T, n = 11 cells; T246M, n = 6 cells. Each mutant vs. WT Stub1: N65S, P = 0.0123; A79D, P = 0.0315; L123V, P = 0.0143; K144X, P = 0.0066; M240T, P = 0.0119; T246M, P = 0.0023 (one-tailed t test). d WT, n = 13 cells; N65S, n = 10 cells; A79D, n = 13 cells; L123V, n = 10 cells; K144X, n = 11 cells; M240T, n = 9 cells; T246M, n = 12 cells. Each mutant vs. WT Stub1: N65S, P = 0.0259; A79D, P = 0.0186; L123V, P = 0.0021; K144X, P = 0.0038; M240T, P = 0.0090; T246M, P = 0.0100 (one-tailed t test). e The effect of Ataxia-related Stub1 mutant expression on LC3B recruitment onto ROS-stressed peroxisomes in NIH3T3 cells expressing diKillerRed-PTS1, EGFP-LC3B, and PMP34-TagBFP. Control, n = 10 cells; L123V, n = 10 cells; K144X, n = 13 cells; M240T, n = 11 cells; T246M, n = 11 cells; H261Q, n = 10 cells. Each mutant vs. Control: L123V, P = 0.0016; K144X, P = 0.0023; M240T, P = 0.0012; T246M, P = 0.0012; H261Q, P = 0.0013 (one-tailed t test). All error bars in c–e represent the mean ± SEM. Source data are provided as a Source data file.

