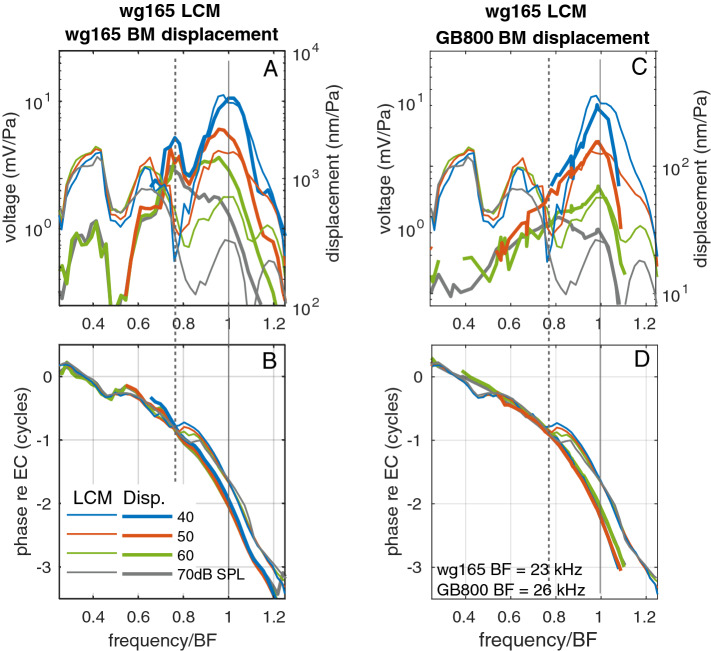
Figure 2.
(A, B) Previously published data5 (exp. wg165) in which LCM and displacement were measured using a dual pressure-voltage sensor. All quantities are referenced to EC pressure. (A) Magnitude of LCM (thin) and BM displacement (thick). (B) Phase of LCM (thin) and BM displacement (thick). (C, D) Here LCM from wg165 are plotted with displacement found with a laser-based method (exp. GB800). These panels are included to reinforce the findings of (A, B). (C) Magnitude of LCM (thin) and BM displacement (thick). (D) Phase of LCM (thin) and BM displacement (thick). Positive displacement direction is up in Fig. 1, in the direction of the scala media. (Note: In the simultaneously gathered data of (A) and (B), a peak at 0.4 CF and dip at 0.5 CF are apparent in both displacement and LCM. Such a feature is not generally present; it might be due to a sound calibration or middle ear resonance in this preparation).

