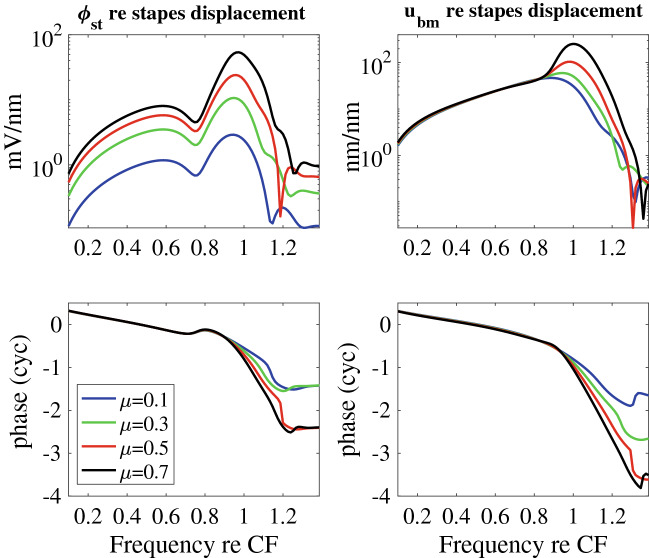
Figure 6.
Theoretical predictions of the magnitude and phase of (A) the amplitude of the transfer function between and the stapes motion and (B) the BM displacement gain (relative to the stapes displacement) as a function of SPL and frequency (normalized to the CF = 15 kHz). Variation of the input SPL on the gain is modeled by altering the MET sensitivity controlled by the parameter defined in Eq. 1. The voltage responses show the notch at 0.76 CF kHz while the onset of the BM nonlinearity occurs at slightly higher frequencies close to 0.82 CF (where low corresponds to a higher SPL as described in the “Materials and methods”). The frequency of the notch is relatively independent of SPL. This is consistent with the measurements up to 70 dB SPL in Fig. 4 and 85 dB in Fig. 2B.

