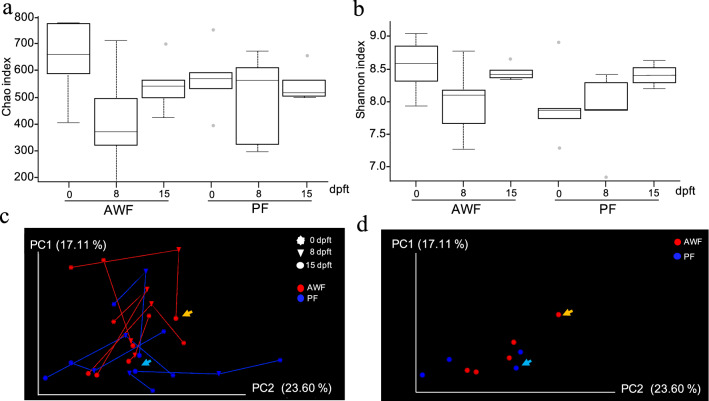
Figure 9.
Longitudinal analysis on rarefied fecal samples from AWF and PF groups. Alpha diversity was computed through Chao1 index (a) or Shannon–Wiener’s metrics (b) at 0, 8 and 15 days post-fecal-transplantation (dpft). Dotted lines represent the standard deviation and outliers are indicated with grey points. Beta diversity was estimated through weighted Unifrac distances comparing AWF and PF at 0, 8 and 15 dpft (c). The microbiota composition of each animal at each timepoint is represented with triangles for 0 dpft, spheres for 8 dpft and hexagons for 15 dpft. The lines join the microbial composition for each animal at different timepoints (in red for AWF and blue for PF). The beta diversity for AWF and PF at 15 dpft is represented by disabling the visibility of other timepoints (0 and 8 dpft) for better visualization (d). The arrows indicate the microbial composition of AWF#44 and PF#22 at 15 dpft in orange and light blue, respectively. The principal axes are shown with the percentage of variation explained between brackets. *P < 0.05 and **P < 0.01.

