
Figure 1. Pancreatic Cancer Cells Sustain Growth during Severe Hypoxia.
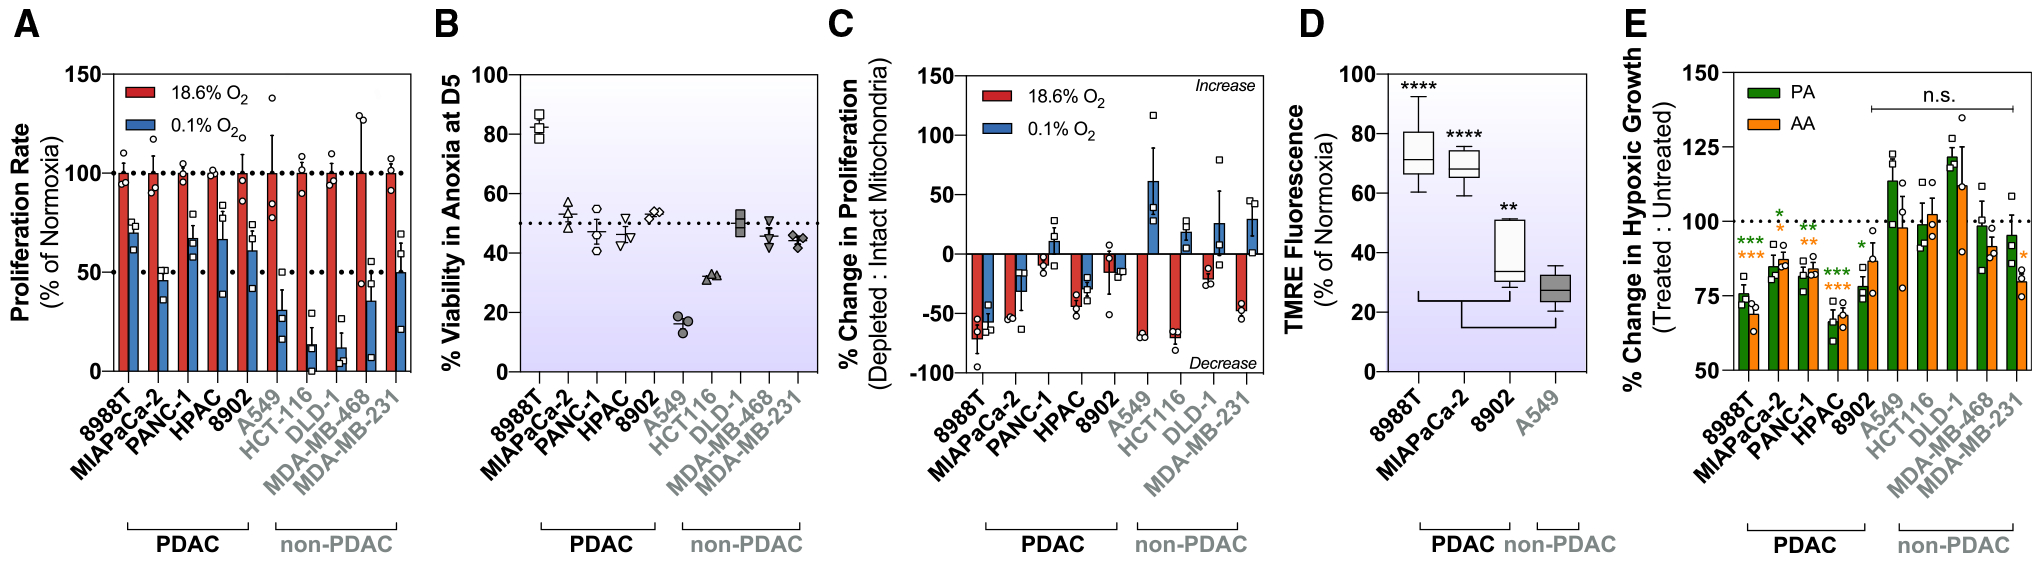
(A) Relative proliferation rates of cells exposed to 0.1% oxygen, shown as a percentage of normoxic growth (mean ± SEM, n = 3). Proliferation rates were calculated using the exponential growth equation from three independent growth curves shown in Figure S1.
(B) Percentage of viable cells after 5 days (D5) in anoxia (0% O2) (mean ± SEM, n = 3).
(C) Change in normoxic and hypoxic (0.1% O2) growth in cells with intact or depleted mitochondria (p0). p0 is shown as a percentage of intact mitochondria (mean ± SEM, n = 3).
(D) Membrane potential measurements using tetramethylrhodamine (TMRE) in normoxic and hypoxic (0.1% O2) conditions. 10–20 fields recorded per condition. Hypoxic data are shown as a percentage of normoxic conditions.
(E) Hypoxic (0.1% O2) cells treated with ETC inhibitors piericidin A (25 nM), and antimycin A (50 nM) for 5 days. Treated cells are shown as a percentage of untreated cells (mean ± SEM, n = 3).
Significance was determined using Dunnett’s multiple comparison test in (D) and (E), where n.s. ≥ 0.05, *p < 0.05, **p < 0.01, ***p < 0.001, and ****p ≤ 0.0001.