
Figure 5. Respiratory Efficiency through Supercomplex Assembly Is Important for In Vivo Growth.
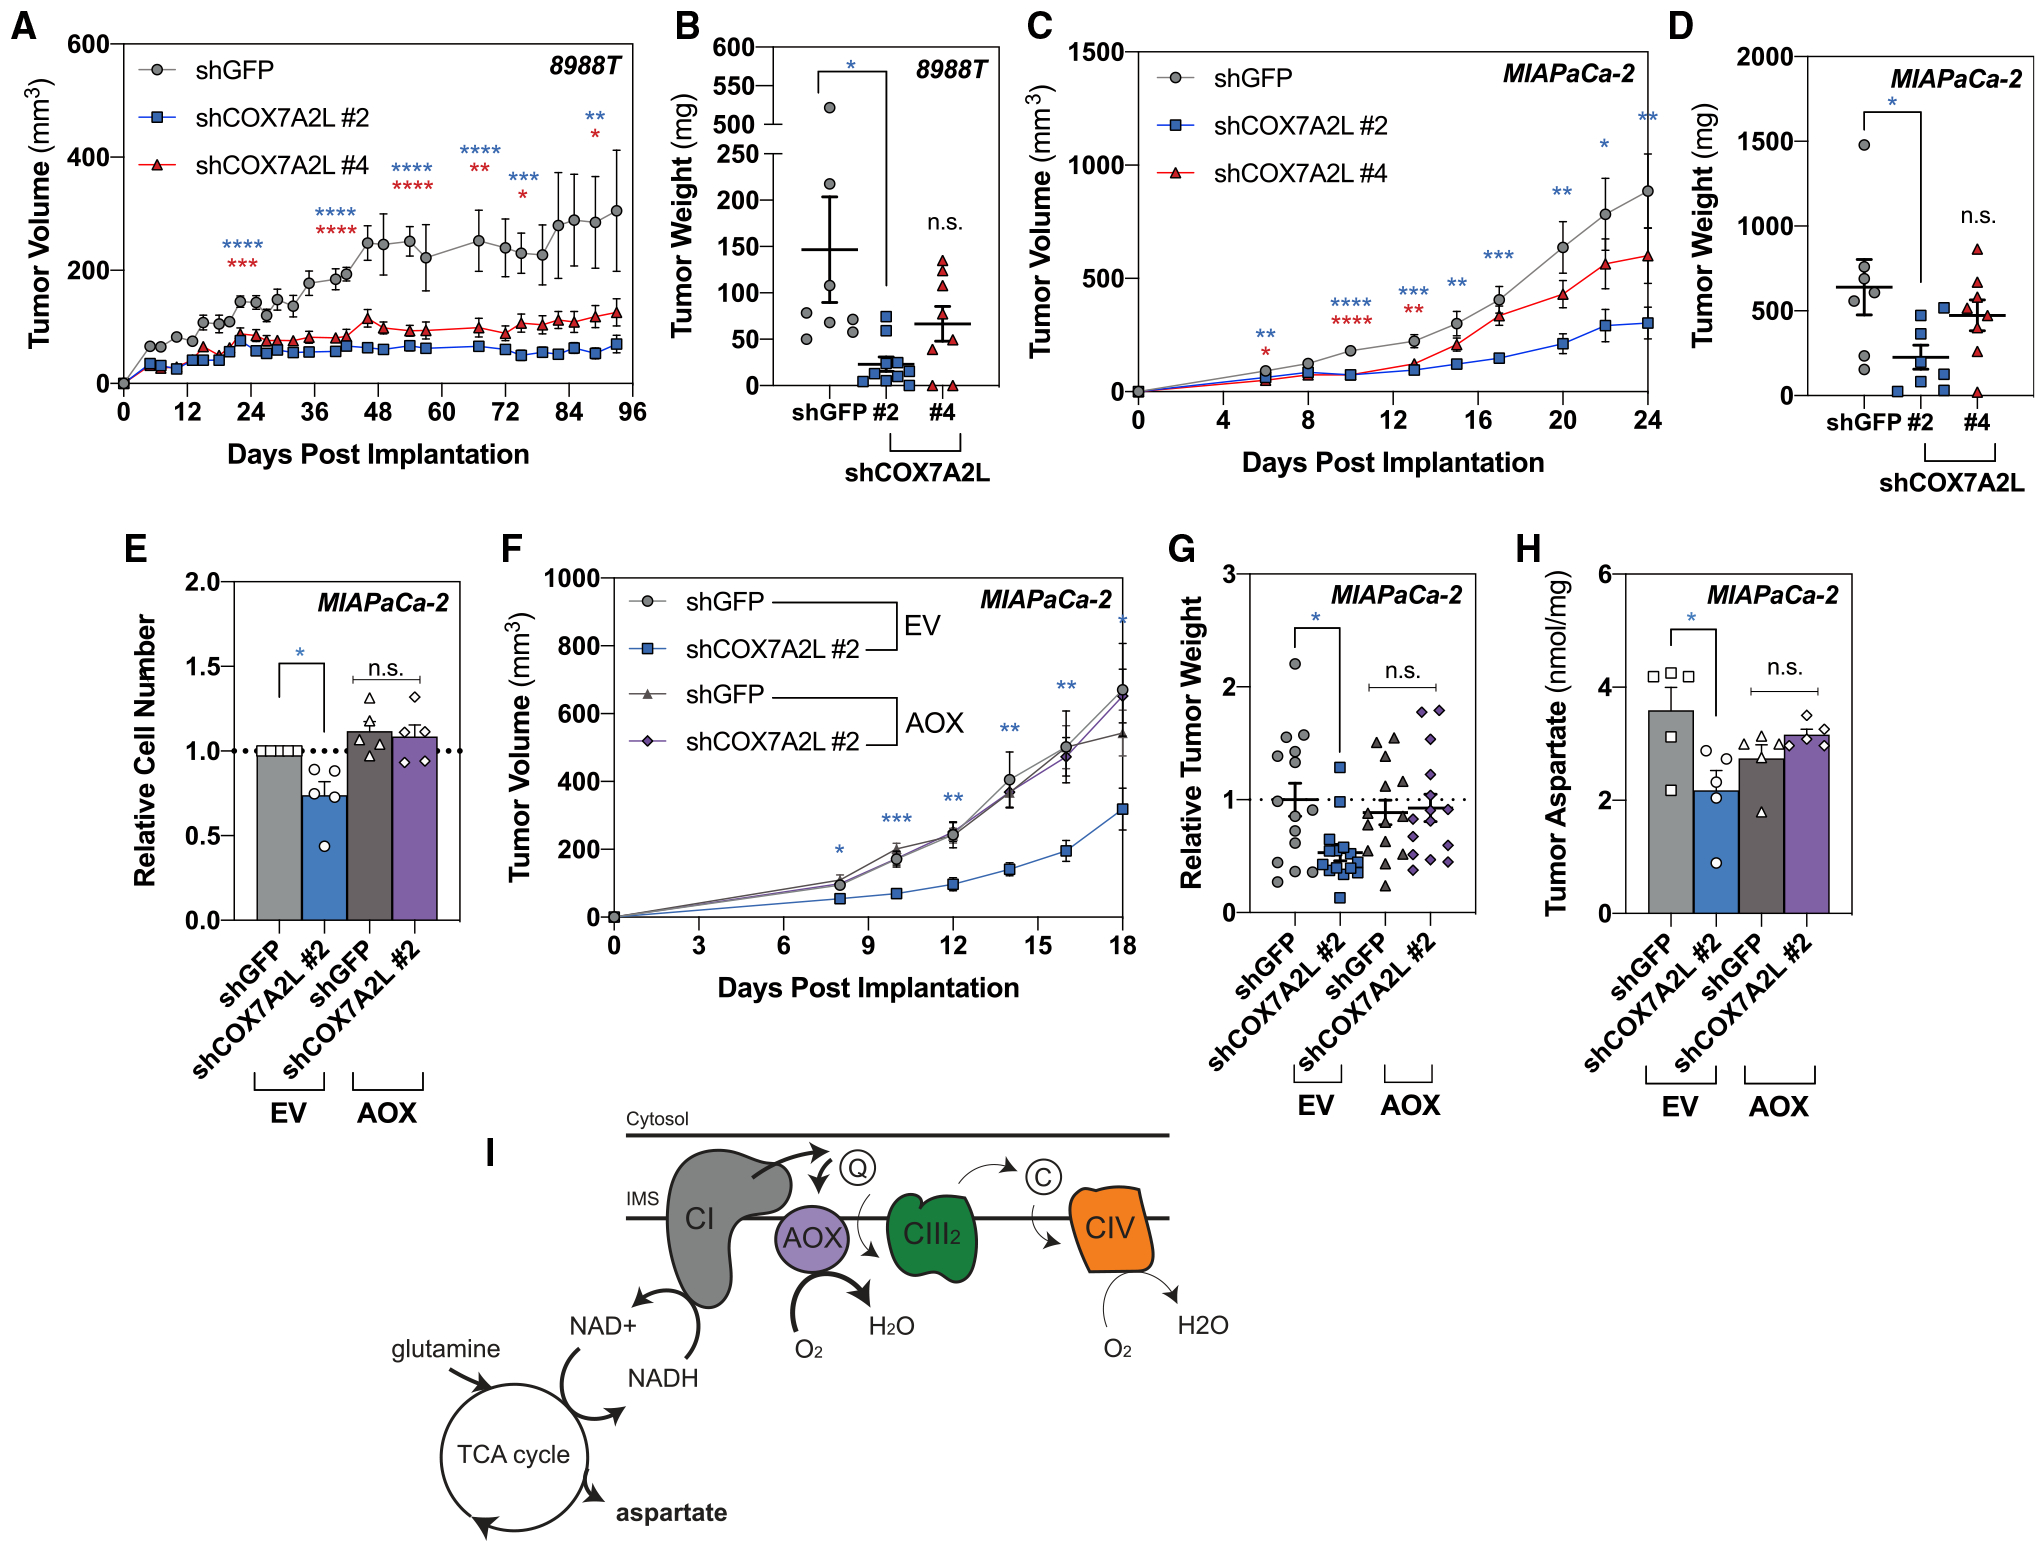
(A) Measurements to determine tumor volume were recorded to assess tumor growth after 2 × 10⁶ 8988T cells with loss of COX7A2L were implanted subcutaneously (mean SEM, n ≥ 8 per group, p = 0.015 at day 93).
(B) Tumor weight was measured at the endpoint (mean SEM, n ≥ 8 per group, p = 0.021 at day 93).
(C) Measurements to determine tumor volume were recorded to assess tumor growth after 2 × 10⁶ MIAPaCa-2 cells with loss of COX7A2L were implanted subcutaneously (mean SEM, n ≥ 7 per group, p = 0.0059 at day 24).
(D) Tumor weight was measured at the endpoint (mean SEM, n ≥ 7 per group, p = 0.0302 at day 24).
(E) Relative cell number after 5 days of proliferation at 1% oxygen in MIAPaCa-2 cells expressing empty vector (EV) or AOX on loss of COX7A2L (mean ± SEM, n = 5, p = 0.0223).
(F) Measurements to determine tumor volume were recorded to assess tumor growth after 2 × 10⁶ MIAPaCa-2 cells expressing EV or AOX on loss of COX7A2L were implanted subcutaneously (mean SEM, n ≥ 9 per group, p = 0.0271 at day 18).
(G) Tumor weight was measured at the endpoint from two independent experiments (mean SEM, n ≥ 14 per group, p = 0.0147).
(H) Tumor aspartate levels quantified by gas chromatography-mass spectrometry (GC-MS) from 5 mg of tissue harvested at day 12 (mean SEM, n = 5, p = 0.0116).
(I) Schematic demonstrating how AOX-expressing pancreatic cancer cells rescue the metabolic and proliferative defects associated with loss of supercomplex formation in hypoxic pancreatic cancer cells.
Significance was determined using Dunnett’s multiple comparison test in (A)–(G), where n.s. ≥ 0.05, *p < 0.05, **p < 0.01, ***p < 0.001, and ****p ≤ 0.0001.