
Figure 3. Comparison of Daily Heart Rate and Weight Change in Participants Treated With Higher-Calorie Refeeding (HCR) vs Lower-Calorie Refeeding (LCR).
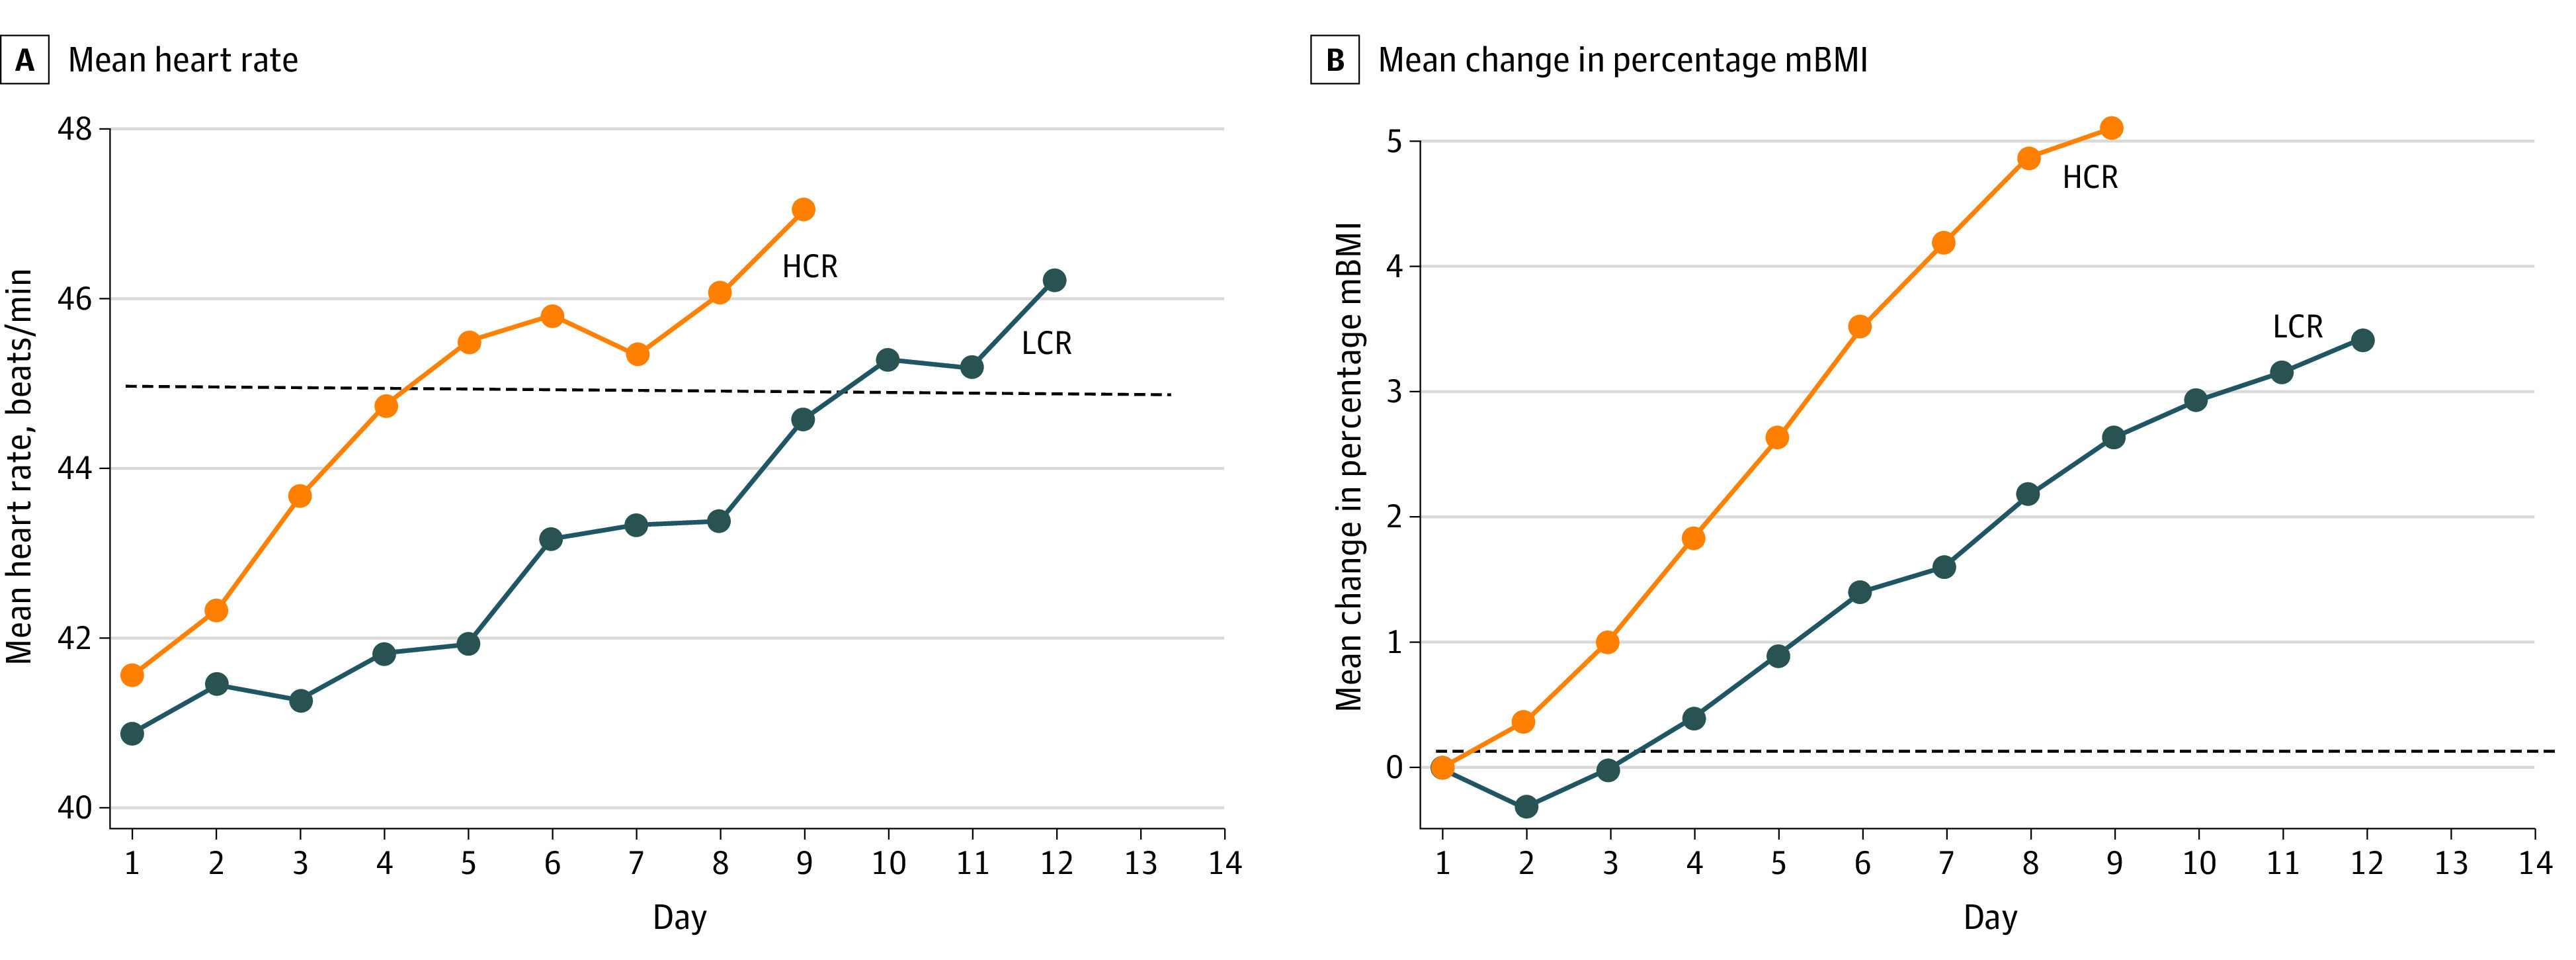
A, Mean heart rate. The dashed line indicates heart rate stability threshold (45 beats/min for 24 hours). B, Mean change in percentage mBMI (50th percentile body mass index for age and sex). The dashed line indicates baseline weight.