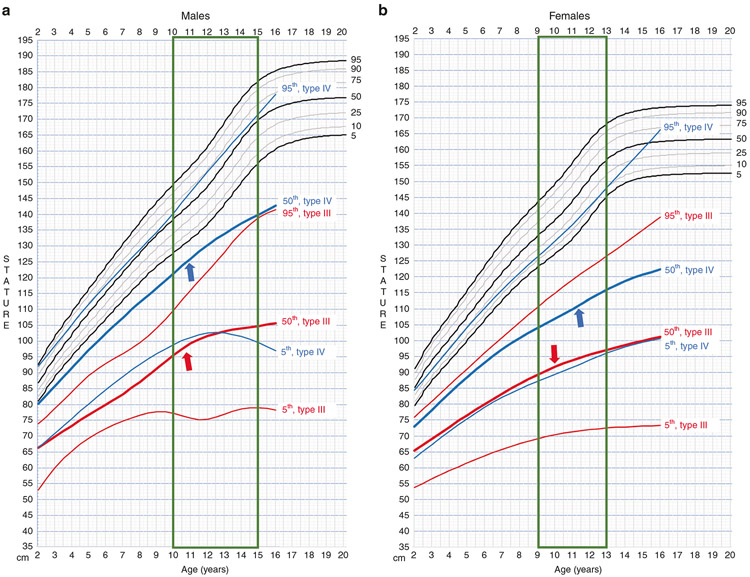
Fig. 2. Osteogenesis imperfecta (OI)-specific linear growth curves plotted against Centers for Disease Control and Prevention (CDC) growth curves for general US population.
Growth charts for a males and b females. For both genders, the centile curves of types III (red) and IV (blue) overlap. The vertical box (green) highlights age range for pubertal growth spurt. Individuals with type III (red arrows) and IV (blue arrows) OI have blunted growth spurt.

