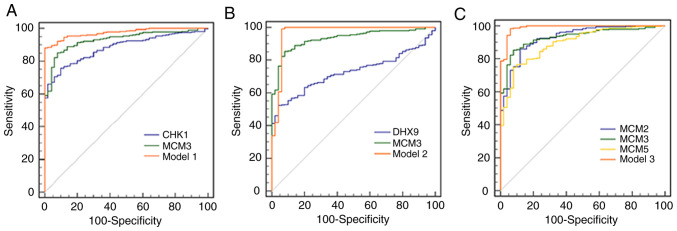
Figure 5.
ROC curves of different genes and combined models for diagnosis of hepatocellular carcinoma. The orange solid ROC curve represents models with combined proteins. (A) ROC curves of CHK1, MCM3 and model 1. Model 1 was the combination of CHK1 and MCM3. P<0.05 for AUC of Model 1 vs. CHK1 or MCM3. (B) ROC curves of DHX9, MCM3 and model 2. Model 2 was the combination of DHX9 and MCM3. P<0.05 for AUC of Model 2 vs. DHX9 or MCM3. (C) ROC curves of MCM2, MCM3, MCM5 and model 3. Model 3 was the combination of MCM2, MCM3 and MCM5. P<0.05 for AUC of Model 3 vs. MCM2, MCM3 or MCM5. ROC, receiver operating characteristic; CHK1, checkpoint kinase 1; MCM, minichromosome maintenance complex component; AUC, area under the curve; DHX9, DEAH (Asp-Glu-Ala-His) box helicase 9.

