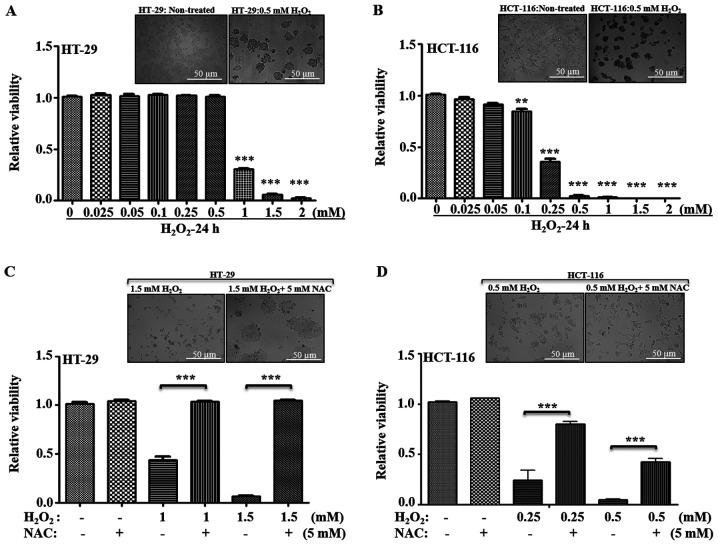
Figure 5.
Effect of oxidative stress on cellular viability. (A) HT-29 and (B) HCT-116 cells were treated with varying concentrations of H2O2 for 24 h, and viability was measured using trypan blue staining. The relative fold changes in the viability was calculated considering control as 1 and compared with viability of cells at different H2O2 concentrations. Representative bright field images are provided for non-treated and 0.5 mM H2O2 treated cells. Similarity, the effect of antioxidant (NAC: 5 mM) on (C) HT-29 and (D) HCT-116 cell survival, with or without the H2O2 at given concentrations, was measured and compared with their non-treated control. Representative images indicate the recovery of cells after NAC treatment. Scale bar, 50 µm. **P<0.01 and ***P<0.001 vs. 0 mM H2O2/at indicated H2O2 concentrations without NAC. NAC, N-acetyl cysteine.

