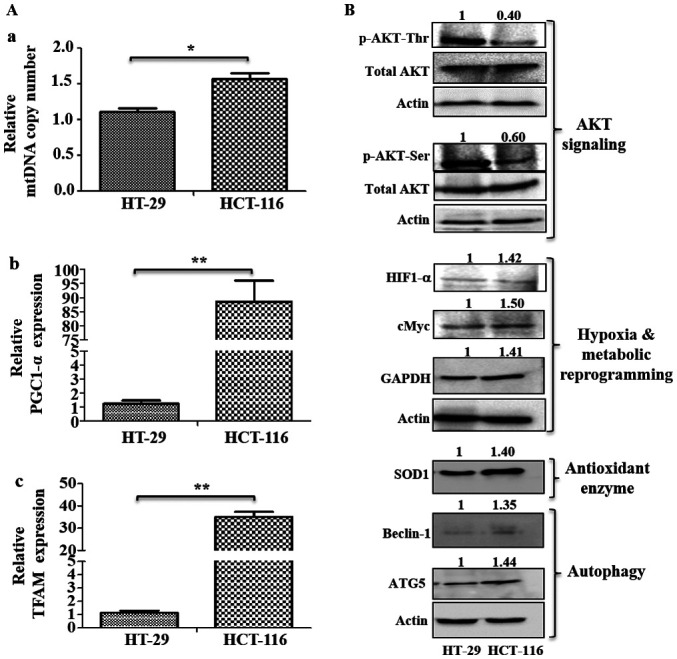
Figure 6.

Analysis of mitochondrial biogenesis and signaling pathways. (A) Mitochondrial biogenesis was measured via mtDNA copy number and mRNA expression of mitochondrial biogenesis markers. (A-a) Changes in mtDNA copy number were determined using the SYBR green qPCR method. mRNA expression levels of (A-b) mitochondrial biogenesis marker PGC1-α and (A-c) TFAM were analyzed using reverse transcription-quantitative PCR. (B) Immunoblotting was performed to analyze the expression levels of p-AKT (Ser 478 and Thr 308), HIF1-α, cMyc, GAPDH, SOD1, Beclin-1 and ATG5. Values represent relative band intensities of protein that were measured by densitometry, normalized with actin loading control and presented as relative to HT-29. p-AKT (Ser 478 and Thr 308) proteins were normalized with total AKT as well as actin, and other proteins were normalized with β-actin as loading control. *P<0.05 and **P<0.01. p-, phosphorylated; HIF1-α, hypoxia inducible factor 1 subunit α; SOD1, superoxide dismutase 1; ATG5, autophagy related 5; PGC1-α, Peroxisome proliferator-activated receptor γ coactivator α; TFAM, mitochondrial transcription factor A; mtDNA, mitochondrial DNA.
