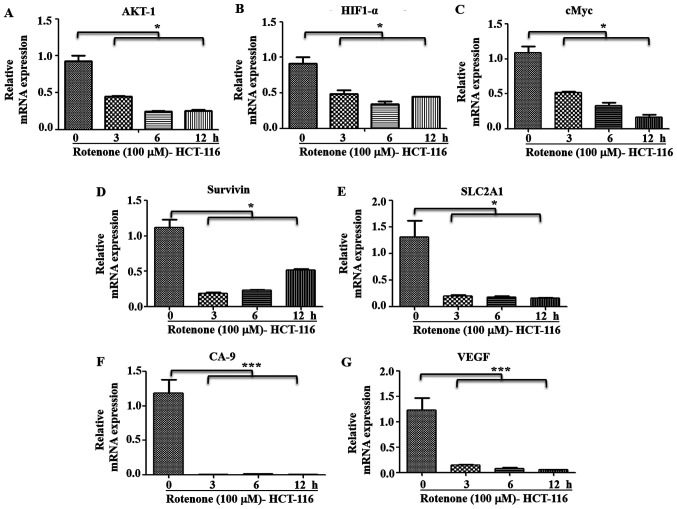
Figure 8.
Effect of C-I inhibition on metastatic signaling. HCT-116 cells were treated with rotenone (100 µM) for indicated time points, and RNA was used for reverse transcription-quantitative PCR. mRNA expression levels of (A) AKT-1, (B) HIF1-α, (C) cMyc, (D) Survivin, (E) SLC2A1, (F) CA-9 and (G) VEGF genes were analyzed using SYBR green dye. Fold changes were calculated relative to non-treated control at 0 h. *P<0.05 and ***P<0.001. HIF1-α, hypoxia inducible factor 1 subunit α; SLC2A1, solute carrier family 2 member 1; CA-9, carbonic anhydrase-9.

