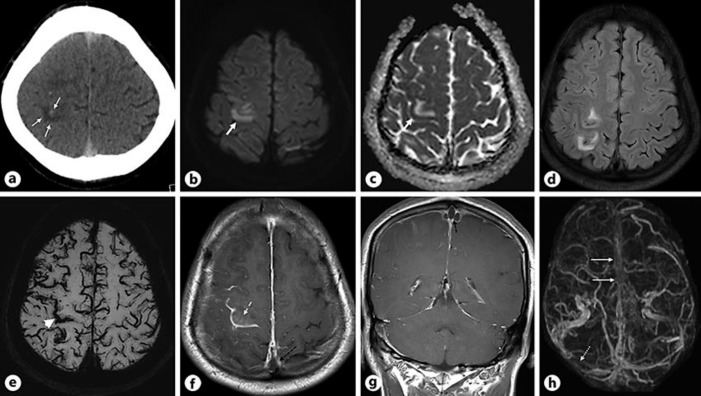
Fig. 3.
aAxial non-contrast CT section of the head shows hemorrhagic infarcts in the right high frontal lobe (white arrows). b, cAxial DWI and ADC map demonstrate venous infarct in the right high frontal lobe (thick white arrow). dAxial FLAIR image reveals patchy hyperintensity in the right high frontal lobe. eAxial SWI image shows prominent cortical veins suggesting venous congestion and gyral microhemorrhage in the right precentral gyrus (white arrowhead). f, gAxial and coronal T1W post contrast images demonstrate thrombus in the superior sagittal sinus (dashed black arrow) and enhancement in the right precentral gyrus (white dashed arrow). hPost contrast MRV 3D reconstruction shows non visualization of the superior sagittal sinus (white arrows) and right transverse sinus (dotted white arrow).

