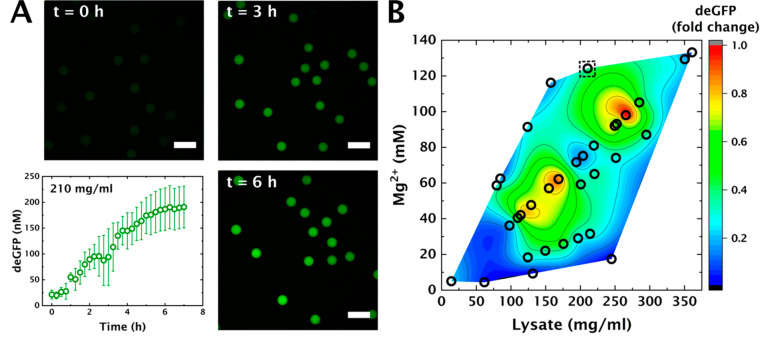
Figure 3.
Cell free gene expression in crowded protocells in varying combinations of [lysate] and [Mg2+]. (A) deGFP expression inside shrunk liposomes with lysate concentration at 210 mg/mL. The error bars indicate standard deviation when measuring fluorescence in multiple liposomes (n = 15). Scale bar: 100 μm. (B) Contour plot denoting amount of deGFP produced in shrunk liposomes corresponding to different concentrations of lysate and Mg2+ after 4 h at 21 °C. The dotted square denotes the protein yield corresponding to IVTT denoted in caption A. [Mg2+] was varied by changing the amount of magnesium added in the IVTT mix. The fold change is calculated with respect to the maximum amount of protein produced, corresponding to lysate concentration ∼260 mg/mL.

