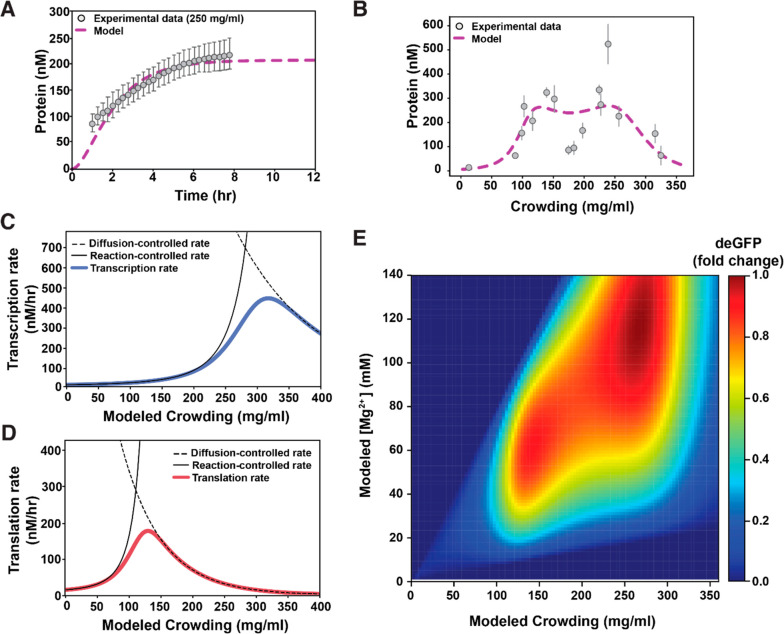
Figure 4.
Mathematical modeling of gene expression as macromolecular crowding is increased. (A) The model fit to experimental time-lapse data at 250 mg/mL of macromolecular crowding to obtain values for kdep and Res (RMSE = 10.1). The error bars in the experimental data correspond to standard deviation when measuring fluorescence in multiple liposomes (n = 19). (B) The model fit to experimental protein yield at 4 h, for varying concentrations of macromolecular crowding conditions to obtain values for Δux/l. The error bars in the experimental data correspond to standard deviation over liposomes imaged corresponding to each lysate concentration. The number of liposomes corresponding to each lysate concentration ranged between 4 and 23. (C and D) Black dashed lines represent the diffusion-controlled rates calculated from the experimental data in Figure 2A. Black full lines represent the reaction-controlled rates calculated from the experimental data in Figure 4B; blue and red full lines represent the transition from reaction-to-diffusion control for transcription and translation, respectively. (E) Modeled fold change in deGFP produced for different amounts of modeled macromolecular crowding and final [Mg2+] in shrunk liposomes. The fold change is calculated with respect to the maximum amount of protein produced corresponding to ∼260 mg/mL of lysate.

